Posted by Elena del Valle on November 18, 2013
U.S motorization study by Michael Sivak
In 2011, based on the most recent data available, the average driver in the United States consumed 585 gallons of fuel or 1,033 gallons per household. Recent studies indicate that Americans, in general, own fewer light-duty vehicles, drive each of them less, and consume less fuel than in past years.
According to the results of a study (one of three on the subject conducted) released this month, researchers believe fuel consumption rates per person, per licensed driver, per household, and per registered vehicle and distance-driven rates peaked in 2003 or 2004, before the ongoing economic downturn.
By 2011, they had decreased by 13 percent to 17 percent. The researchers believe the long term peak was reached around 2003 or 2004.
They concluded Americans drive fewer light-duty vehicles, defined as cars, pickup trucks, SUVs, and vans; they drive each of them less, and consume less fuel. They also estimate that current fuel consumption rates are lower than they were in 1984 when they began to track the information.
The 17-page report, titled Has Motorization in the U.S. Peaked? Part 3: Fuel consumed by light-duty vehicles was authored by Michael Sivak, director, Sustainable Worldwide Transportation, University of Michigan Transportation Research Institute. Earlier this year, he published two reports in which he looked at recent trends in the numbers of registered light-duty vehicles in the United States and the corresponding distances driven.
Posted by Elena del Valle on October 14, 2013

Three researchers examined TIGER indexes for 23 countries
Is the world economy improving? Yes, sort of. After examining key economic indicators of a group of advanced and emerging markets three researchers concluded the economic turn around remains slow and uncertain. Eswar Prasad, Karim Foda and Arnav Sahu, authored the October 2013 Update to TIGER: Tracking Indexes for the Global Economic Recovery published this month by The Brookings Institution and the Financial Times.
Growing confidence in advanced economies and stable growth in emerging markets are driving the economic climate. The analysts are convinced that the economy “remains just a shock or two away from turning into another slump.”
They shared TIGER indexes for 23 countries and charts for the indicators indexes, each including real activity, financial and confidence indicators. The countries are Argentina, Australia, Brazil, Canada, China, France, Germany, Greece, India, Indonesia, Ireland, Italy, Japan, Korea, Mexico, Netherlands, Portugal, Russia, South Africa, Spain, Turkey, United Kingdom and United States.
The Overall Growth Index, the Real Activity Index and other charts for the United States, for example, show a deep slump in 2009 with varying degrees of recovery since. The confidence index was the most worrisome.
It appears the worst is over for advanced economies including Europe, Japan, United States, and United Kingdom. The latter “is experiencing surprisingly good growth.” Overall in advanced economies although jobs creation is weak and financial conditions are mixed confidence in the private sector has increased and inflation is modest. We’re not out of danger, seems to be the cautionary message which points to the need for growth.
At the same time, emerging market economies, such as China, India and Brazil, which had stopped growing are looking stronger. Private sector confidence in these countries had been poor recently and has improved somewhat.
Eswar Prasad is senior fellow, Global Economy and Development
new century chair in International Trade and Economics. Karim Foda is research associate, Global Economy and Development,
and Arnav Sahu is a student at Cornell University.
Posted by Elena del Valle on August 19, 2013

Up to 20 percent of broccoli’s nutritional content is from protein
Photos: HispanicMPR.com, Truth Be Told
Although only seven percent of people in the United States claim to be vegetarian and increasing number of consumers indicate they are purchasing meat alternatives, according to Meat Alternatives US June 2013, a Mintel report available for purchase at $3,995. In 2012, sales of meat alternative products across a variety of conventional and specialty channels, reached $553 million, according to the survey company’s data. That was equivalent to an 8 percent growth compared to 2010.
Popular meat alternatives include seitan, almonds, soy and soy derivative products such as tempeh and tofu, legumes and beans, dairy products such as cheese, milk and yogurt, quinoa, and broccoli to name a few. Some people consume these items to cut back on the costs of expensive meat products. Some shoppers like their health benefits while others seek to replace meat and protein in their diets.

Tofu Shirataki noodles
One such product promoting health and variety is Tofu Shirataki noodles made with tofu and Japanese yam powder or konnyaku. The products are touted as a low-calorie healthy alternative to wheat pastas since each four-ounce serving has only 20 calories and three grams of carbohydrates. The promotional materials point to the benefits of soy and added protein. Similar examples cram the shelves of supermarkets and health food stores.
Thirty-six percent of respondents to a March 2013 survey of 2,000 adults by Mintel said they buy meat alternative products. Those consumers indicated they purchase such products for their health benefits rather than as meat substitutes.
Many respondents (67 percent) who didn’t say they purchased meat alternatives indicated they preferred real red meat while 34 percent said they didn’t enjoy the flavor of alternative products and 20 percent said they didn’t like the texture.
Asians and Hispanics rely more heavily on the use of meat alternatives compared to other consumer segments and Hispanics want variety, according to Mintel findings. These market segments appear to consume meat alternatives more than once per week.
White shopper who responded to the survey over index in their consumption of meat alternatives because they believe they are healthy. Respondents from other race groups said the are more likely to buy the products for their the taste.
Asian (45 percent) and Hispanic (46 percent) shoppers who took the survey said the are more likely than average to cook with meat alternatives in addition to meat and less likely than average to use the products as meat substitutes. Hispanic and Asian survey takers said they are also more likely to serve meat alternative products as a side dish than as mains.
In addition, the report indicates Hispanic shoppers who took the survey said they are interested in information about these products. They would like to know about the ingredients they are made from and how to cook with them.
Posted by Elena del Valle on June 24, 2013

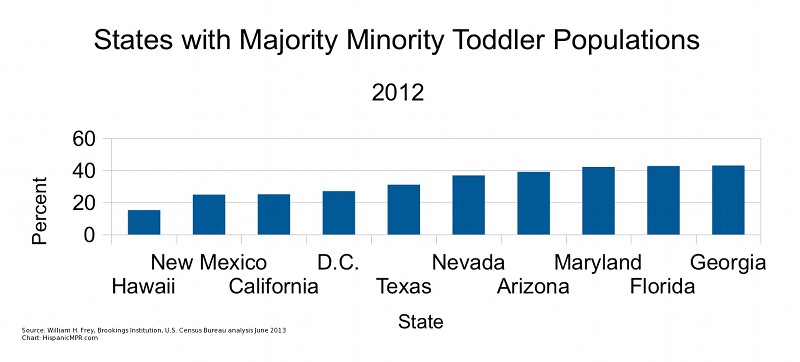
States with Majority Minority Toddler Populations 2012 – click to enlarge
For years there has been debate about the demographic face of America. Experts have estimated growth, births, deaths and juggled data to predict what our country will look like in coming decades. Newly analyzed Census 2010 information points to an unprecedented change in our nation’s racial and ethnic profile in 14 states. Data on ten of the states is represented in the graphic in this article. Four additional states were excluded to keep the graphic size manageable: New Jersey, New York, Mississippi and Delaware.
Non Hispanic whites are dying at a faster rate than they are born. This was anticipated. The speed at which it is happening is what is unexpected. Three states, Texas, New Mexico and California, have already reached majority-minority status, according to The Brookings Institution, a nonprofit public policy organization.
William Frey, senior fellow there, indicated in a recent article (Shift to a Majority-Minority Population in the U.S. Happening Faster than Expected) that the country is at the beginning of “an inevitable transition that affords us new opportunities.” Booming minority births, fewer births and more deaths among whites, and immigration are driving these changes, according to his article.
Posted by Elena del Valle on June 17, 2013

Homemade hummus, a spread made with mashed chickpeas, oil, garlic, and lemon juice
Photo: HispanicMPR
Americans like ethnic foods. That market segment is estimated at $8.7 billion for last year. Young adults and families with children like to prepare ethnic foods at home. Nine of ten adults 25 to 34 years of age in the United States who took a Mintel survey said they prepared ethnic food at home the previous month.
Among older adults 65 and older who took the survey 68 percent responded positively to the same question. Most people with children at home, 91 percent, said yes to the question compared to 78 percent among people with no children.
Mintel analysis in Ethnic Foods US January 2013 indicates the 12 percent growth in ethnic food sales between 2007 and 2009 was due to people eating in restaurants less often and dining at home more often to save money. While growth of ethnic food slowed to 4.5 percent from 2010 to 2012, according to Mintel that market segment is forecast to grow 20 percent between 2012 and 2017.
Hispanic food among survey takers was the most popular. More than half, 58 percent, said they prepared Hispanic food within the last month versus 55 percent who indicated they made Italian dishes and 44 percent who chose Asian food.
“The popularity of Hispanic food is likely due to how mainstream it has become in the US and the ease and convenience of preparing it,” said John N. Frank, category manager, CPG food and drink, Mintel, in a press release. “The endless supply of Mexican, Cuban and other Hispanic-based restaurants have given home cooks infinite possibilities for re-creating these restaurant-style meals at home.”
The largest (in terms of sales) of the ethnic food market’s five segments, per Mintel data, is Mexican/Hispanic although the growth for that type of food was negligible from 2010 to 2012. The next segment, while much smaller, corresponds to Asian food which had a 10.2 percent dollar sales increase and a 1 percentage point market share growth in the same time period.
Mediterranean/Middle Eastern foods, the third largest segment while much smaller than the other two, grew the most in those two years and is forecast to grow the most in dollar sales between 2012 and 2017. The ethnic food category, Mintel research indicates, responds to price and deals. Survey respondents exhibited low brand loyalty.
Authenticity is the top ethnic food characteristic, according to a July 2012 article (Research Spotlight: Ethnic Foods: Flying High) in SpecialtyFood.com. The article suggests that food manufacturers and marketers would increase consumer interest in their products, women and seniors in particular, by providing and promoting products with health benefits which interest both segments.
Posted by Elena del Valle on April 25, 2013
Information provided by Event and Program Partner

The National Hispana Leadership Institute’s Latinas Learning to Lead Program
The Latinas Learning to Lead program targets college-enrolled, 18-24 year old Latinas that are seeking to impact their community. The program promotes and fosters the career and educational development of young Latina leaders through training, mentoring opportunities, and access to national networks.
The LLL program annually selects about 22 fellows. Session topics include effective communication and presentation skills, advocacy training, public policy issues affecting the Latino community and other professional and leadership development topics, such as financial literacy and career opportunities.
Application and program deadlines are as follows:
-
Wednesday, May 15, 2013 at 5 pm EST: Application deadline
- Mid May: Application notifications
- July 21-27th, 2013: Leadership Training in Washington, DC
- July 28th and beyond: Participate in Mentorship Programs
-
July 2013-2013 Fall semester/quarter: Leadership projects implemented in communities
For more program and application information visit www.nhli.org or contact NHLI at Programs@nhli.org.
Posted by Elena del Valle on March 18, 2013

In the past five years 471 banks have failed in the United States. Their failure has resulted in $95.5 billion in losses and nearly emptied the Federal Deposit Insurance Corporation (FDIC) coffers.
According to a Los Angeles Times article, the FDIC policy has been to settle and keep the information out of the public eye. Relying on the Freedom of Information Act the California newspaper obtained 1,700 pages of FDIC settlements from 2007 to this yea. The settlements with bank insiders were for fraud, negligence, reckless loans, falsified documents, inflated appraisals and lender refusals to purchase back bad loans.
One of the most noteworthy settlements was for $54 million with Deutsche Bank, the world’s largest bank today, over unsound loans that led to a huge bank failure. The bad loans, the article outlines, played a role in the largest payout in history for $13 billion. Because government representatives struck an agreement with the bank with a no press release clause the FDIC was required to remain silent about the terms save in case someone asked specifically about it.
While in past decades the FDIC used to make public punitive actions against banks now the policy is of settle and silence. Since the mortgage crisis the FDIC has settled many agreements in the same way as the Deutsche Bank deal, the article indicates. Such non disclosure agreements are said by some to violate the spirit of the laws that regulate the FDIC.
According to the corporation’s website, “The Federal Deposit Insurance Corporation (FDIC) preserves and promotes public confidence in the U.S. financial system by insuring depositors for at least $250,000 per insured bank; by identifying, monitoring and addressing risks to the deposit insurance funds; and by limiting the effect on the economy and the financial system when a bank or thrift institution fails.”
Although the FDIC maintains a Problem Bank List with the names of institutions likely to have weak capital positions that could results in failure, fearful of the consequences the Corporation does not publicize the list. An unofficial list with a higher number of banks developed from public sources was published December 7, 2012 by CalculatedRiskBlog.com (http://cr4re.com/PBL12072012.html). The list includes the name of each bank, its FDIC number, assets for the most recent quarter, class, agency it falls under, city, state, date of action, type of enforcement action, reason, corrective action when taken and the date it took place, and the ticker.
According to ProblemBankList.com, as of the end of last year there were 651 problem banks on the FDIC list, reflecting a slight decline from 694 on September 30, 2012; the number of Problem Banks has declined for seven quarters in a row from 888 at March 31, 2011. The website compared the official and unofficial Problem Bank lists concluding there are 805 institutions in the unofficial list compared to 651 on the official FDIC confidential Problem Bank List.
Posted by Elena del Valle on March 12, 2013
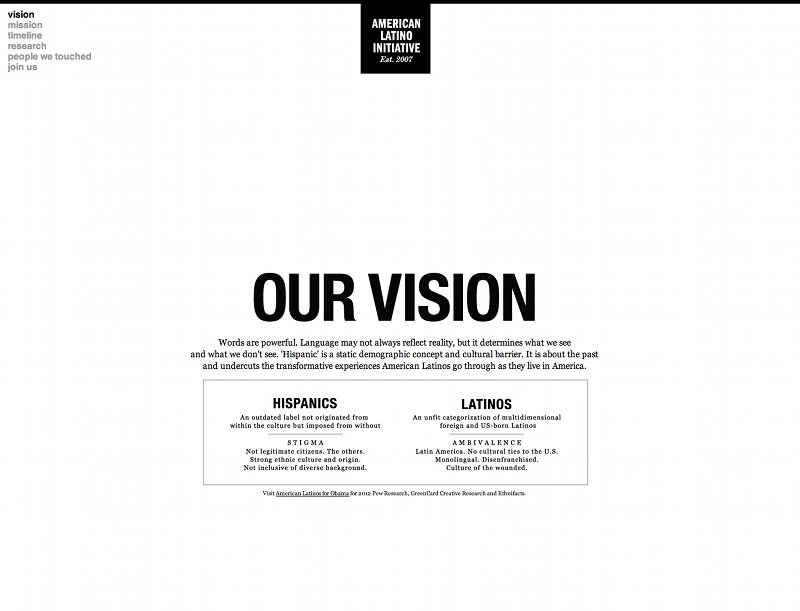
American Latino Initiative homepage – click to enlarge
Images: American Latino Initiative, Greencard Creative
In 2008, a New York branding agency launched the American Latino Initiative and a related website. Convinced the word Hispanic is outdated, “a static demographic concept and cultural barrier. It is about the past and undercuts the transformative experiences American Latinos go through as they live in America,” the agency set out to change people’s minds about the way they see the growing market segment.
The goals of the initiative’s website are “removing the word Hispanic from the American lexicon; debunking myths and changing the industry narrative about American Latinos; and relentlessly advocating for American Latinos until these consumers are seen first and foremost as culturally diverse U.S. Citizens that value their Latino heritage.” Research for the initiative was funded by Greencard Creative and the clients listed on the website. Greencard Creative has worked with Smirnoff Ice, Pepsico/Ocean Spray, Heineken, Diageo, Petit Nectars, Gallo Winery, Johnson & Johnson, Bayer, Frito Lay, Campbell’s, and the Country of Ecuador.
The Greencard Initiative clients listed in the initiative website conducted research to identify ways their brands fit into their clients lives. Every year, as part of its ongoing research, Greencard Creative funds research for the initiative to supplement client funded research which represents 80 percent of the budget or about approximately $780,000.
Toward the initiative’s goal backers produced a national integrated marketing platform with outreach efforts, lectures, branding campaigns, t-shirts and an art exhibit. Representatives estimate they have reached 1.5 million people nationwide, 135 corporations, non-profits organizations and media companies. Initiative supporters believe they played a role in influencing Univision and the New America Alliance to start utilizing the term American Latino.

Tatiana Pagés, chief executive officer and chief creative officer, Greencard Creative
“It’s not about Hispanics anymore, it’s about American Latinos and the transition to their new identity,” said Tatiana Pagés, chief executive officer and Chief Creative Officer, Greencard Creative. “As a Latino entrepreneur, I feel it is my responsibility to challenge the stereotypes of Hispanics in the U.S. that have been overshadowing who they really are, and limiting where they can go as cultural citizens. Companies and brands have the opportunity to understand American Latinos as hybrid individuals beyond the Hispanic mindset, in order to create effective marketing and advertising campaigns to reach and connect with the fastest growing ethnic segment in our country.”
Based on 380 in home interviews, 72 individual interviews, and 77 group interviews in New York City, Los Angeles, Houston, Austin, Miami, and Chicago conducted with a mix of United States and foreign born Latinos between 2006 and 2012 Greencard Creative representatives concluded Hispanics are hybrid individuals, regardless of the length of time residing in the United States, with an identity that combines their original culture with American traits. They concluded these individuals seek experiences, “even when these experiences contradict the norms of Latino culture.”
Posted by Elena del Valle on March 4, 2013
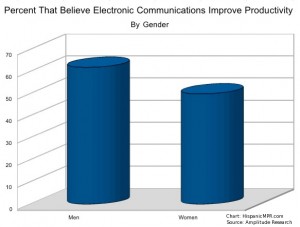
Percent by gender that believe productivity improves with electronic communications
A survey of a nationwide panel of 300 workers who use computers and software as part of their daily job indicates those surveyed regularly communicate in person. Many, 69 percent, respondents said they preferred to share “positive” feedback face-to-face while 63 percent said they prefer to share “negative” feedback that way.
Forty-three percent of respondents said they believed electronic communication improved workplace relationships while only eight percent felt it had a negative impact on relationships. Forty percent of workers said they had worked for an extended period with someone they had never met in person or spoken with on the phone.
Romance via electronic means was seen favorably by some of the respondents. Fourteen percent of survey takers said they flirted with a co-worker by email, texting or instant messaging and 10 percent said they had initiated a workplace romance communicating electronically. When communicating with family from work cell phone calls were the top choice with 36 percent of respondents saying they call family members by cell phone and 20 percent saying they text them.
Men and younger workers were more inclined to consider electronic communication improved productivity. Half of women said they believed electronic communication increased productivity, and 62 percent of men said it increased productivity. Sixty-five percent of respondents 25 to 34 years old said electronic communication increased productivity while 52 percent of those 35 or older said the same.
While few respondents confessed to electronic workplace gossip 44 percent said they liked to gossip in person. When sharing gossip by electronic means 5 percent said they use email; 3 percent said they preferred texting and one percent favored instant messaging. The survey was conducted January 2013 by Amplitude Research on behalf of TrackVia, a Denver based do-it-yourself application builder for business people.
Posted by Elena del Valle on February 25, 2013
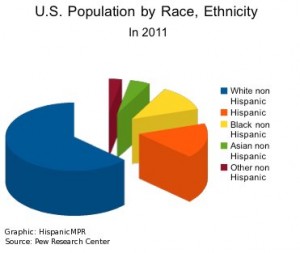
U.S. Population by Race, Ethnicity in 2011 – click to enlarge
In 2011, Hispanics represented 16.7 percent of the United States population and 23 percent of births. In other words, Latinos represented one sixth of the population and almost one quarter of all births. Those estimates, compiled by the Pew Research Center, include undocumented immigrants said to be as many as 12 million and 80 percent of which are thought to be Latinos. Two thirds of Hispanics can be found in just five states: California, Florida, Illinois, New York and Texas, according to analysis of U.S. Census and American Community Survey data by the Pew Research Center.
Overall, the Hispanic population grew 47 percent between 2000 and 2011 from 35.2 million, representing 12.5 percent of the country’s population, to 51.9 million. Growth in some states was higher. An example of such higher growth was Florida where the Hispanic population grew 62 percent in that time period.
Although high school drop out rates among Latinos 16 to 19 years of age are believed to have dropped significantly from 17.5 percent in 2000 to 6.8 percent in 2011 all is not rosy among the growing demographic group. The ethnic group had the next to lowest household income in 2011 when the median income of a Latino household was $39,000 compared to $67,000 for Asian households, $54,000 for whites and $32,600.
Also, 13 million Hispanics, 25.9 percent of the Latino population, are thought to live in poverty and 22 percent receive food stamps; placing second to last on those lists. African Americans at 27.9 percent in poverty and 28 percent on food stamps were the only ethnic group with more alarming conditions. At the same time, Latinos had the highest percent of people without health insurance, 30 percent, compared to 10.8 percent for non Hispanic whites, 15.4 percent for Asians and 18.6 percent for blacks.


(3) non-profit organization working to protect Florida’s springs through sound science and education")


 International")

