Posted by Elena del Valle on August 13, 2014
Photo: U.S. Census Bureau, Public Information Office (PIO)
Unsure about your race or ethnicity? You’re not alone. Almost 10 million (9.8 million) people varied their ethnicity responses between the 2000 and the 2010 censuses. That represents 6 percent of the population of 168 million who changed their minds about their identity between the two national demographic surveys, according to Preliminary Results from America’s Churning Races: Race and Ethnic Response Changes Between Census 2000 and the 2010 Census.
The shift may be explained at least in part due to questionnaire design changes, the report indicates. Analysts observed a race response change among American Indians, Alaska Natives, Native Hawaiians and Other Pacific Islanders, people who reported multiple races, and Hispanics who reported a race. The researchers found little variation among single race non Hispanic whites, blacks, and Asians.
“Compared to adults, children and adolescents may be more likely to change their race/Hispanic responses for two reasons: childhood and adolescence are times of personal identity development and young people’s information was probably reported by their parents in 2000 but may be self-reported in 2010,” researchers said.
The most common change in responses was from Some Other Race (SOR) to single race white among those who identified (or were identified by someone in the household) as Hispanic in both the 2000 and the 2010 censuses. The second most common response change was from single race white to SOR for those who reported (or were reported as) Hispanic in the two censuses.
Specifically, 710,019 respondents changed from white to Hispanic white, and 417,855 changed from Hispanic white to white between one census and the next, according to an Associated Press article (10 million switched ethnicity or race ID on census forms by Jesse J. Holland). Races in the Census are white; black or African American; American Indian or Alaska Native; Asian; Native Hawaiian or Other Pacific Islander; and other for those with more than one race. In addition, there is a Hispanic ethnic category. The article also pointed to people who were children and or living in the West when the 2000 Census took place as the most likely to have modified their responses between the government surveys.
The paper was authored by Sonya Rastogi, PhD, Senior Researcher, Center for Administrative Records Research and Applications (CARRA), Carolyn Liebler, PhD, Assistant Professor of Sociology, University of Minnesota, Leticia Fernandez, PhD, Researcher, CARRA, and James Noon, Researcher, CARR.
Posted by Elena del Valle on June 19, 2014

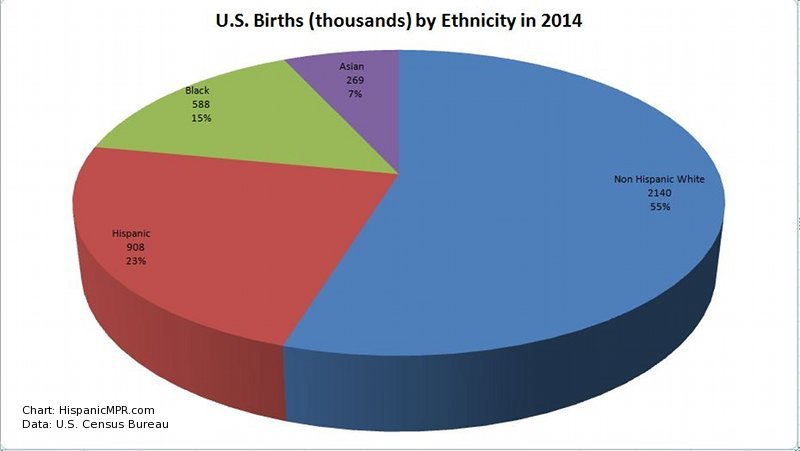
U.S. Births in 2013 by Ethnicity – click to enlarge
What’s the opposite of a baby boom (as in the Baby Boomer Generation)? A baby bust. Last year, 281,000 fewer babies were born than the United States Census Bureau had projected. Instead of 4,238,995 births there were only 3,957,577.
As a result of the bust, non Hispanic whites, with 54 percent of new babies, represent the majority of births. The Census Bureau anticipated only 49 percent of babies would be non Hispanic white.
In 2013, more non Hispanic white babies were born than the Census Bureau had projected. That is 2,140,272 rather than the projected 2,077,212 babies were born. On the other hand, 19 percent fewer Hispanic women gave birth than the Census Bureau had projected. Less than one million (907,859) babies were born to Hispanic mothers instead of the projected 1,122,069.
Following are the 2013 births and percent distribution by race and ethnicity: Asian 268,559 (6.8 percent), Black 587,612 (14.8 percent), Hispanic 907,859 (22.9 percent), and Non Hispanic white 2,140,272 (54.1 percent), according to American Consumers Newsletter June 2014.
Posted by Elena del Valle on May 8, 2014

In 1914, Congress designated the second Sunday in May as Mother’s Day thanks to the efforts of Anna Jarvis, who first organized observances in Grafton, West Virginia, and Philadelphia on May 10, 1908. Four million (4.1 to be exact) women between the ages of 15 and 50 gave birth in the past 12 months, according to U.S. Census Bureau, 2012 American Community Survey (Table B13002).
Almost half of women (47 percent) between 15 and 50 had no children. One in five women in the same age range had two children, 17 percent had one, 10 percent had three and about 5 percent had four or more, according to Fertility of American Women: 2010 (Detailed Tables, Table 1).
In 2012, the average age of women when they had their first child was 25.8 up from 25.6 years the previous year. There was a relatively large decline in births to women in their teen years and their twenties. Jacob and Sophia were the most popular baby names that year.
Less than one third of new mothers (29.5 percent) had a bachelor’s degree or higher while 84.6 percent of said they have at least a high school diploma (source: 2012 American Community Survey, American FactFinder, Table S1301).
In 2011, 35.7 percent of births were to unmarried women age 15 to 50. The metro areas with birth rates to unmarried mothers that were among the highest in the country included Flagstaff, Arizona (74.6 percent), Greenville, North Carolina. (69.4 percent), Lima, Ohio (67.5 percent), Myrtle Beach-North Myrtle Beach-Conway, South Carolina (67.4 percent) and Danville, Virginia. (67.3 percent).
In 2013, there were five million stay at home moms or about the same percent as in the previous two years. That year, almost one quarter (24 percent) of married couple families with children under 15 had a mother at home, up from 21 percent in 2000.
In 2011, Mother’s Day was described as the largest card sending and money sending occasion for United States Latinos of the year, according to a Univision article by Graciela Eleta. She believed that many Latinos who leave their mothers behind when they immigrate take advantage of Mother’s Day to send greeting cards and money transfers (funds are double those of an average month) to their mother in their country of origin.
In 2011, there were 63 births per 1,000 women ages 15 to 44, a low number, led by the drop in births among immigrant women. In 1957, by comparison, it peaked at 122.7 births per 1,000 women of childbearing age. The recent decline in birthrates was greatest, 25.7 percent, among Mexican American women and Mexico born women, according to a 2013 Herald Tribune article (Hispanic pregnancies fall in U.S. as women choose smaller families) that cites Pew Research Center data. In 2010, Hispanic birthrates reached the lowest level in 20 years, according to Pew data.
Posted by Elena del Valle on April 2, 2014

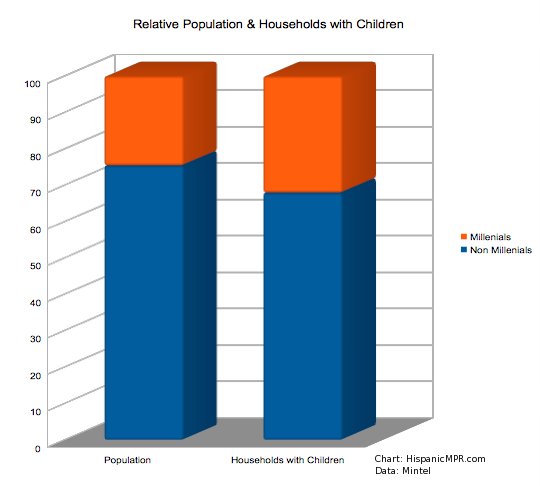
2014 Relative Population & Households with Children – click to enlarge
In the United States, two thirds of Millennials have never been married, according to Marketing to Millennials US February 2014 Executive Summary, a Mintel report. Those who got hitched are in their late twenties. The median age for first marriage is about 29 for men and 27 for women. Thirty-two percent of households with children are Millenial households. At the same time, 43 percent of Millenial households include children.
Although 25 percent of Millenials 25 and older have a bachelor’s degree and 9.5 percent have a graduate degree compared to 11.1 percent of all adults, unemployment among that market segment is higher than for the national average. At the time of the report, 10.3 percent of Millennials between 20 and 24 years old, and 6.8 percent of Millennials aged between 25 and 34 were unemployed. The national unemployment average is 6.5 percent.
There’s a notable difference in household income between younger and older Millenials. While Younger Millennials, those under 25 years of age, have a median household income of $30,604, the median income of Older Millennials, those 25 and older, is about $51,381. The former may be still be studying or in an entry-level job, whereas Older Millennials may be working full-time and more advanced in their career. Mintel researchers believe the 2008 financial crisis caused median income for those aged 15-24 to decline 13 percent between 2007 and 2012, and decline 9 percent for adults aged 25-34.
At the same time, annual spending for Younger Millennials is 40 percent less than for all adults, while among Older Millennials, average expenditures are about 4 percent less. Younger members of the market segment spend less on everything except education. Older Millennials spend a good deal more than all adults on alcoholic beverages and apparel and services, and significantly less on healthcare.
Posted by Elena del Valle on March 20, 2014

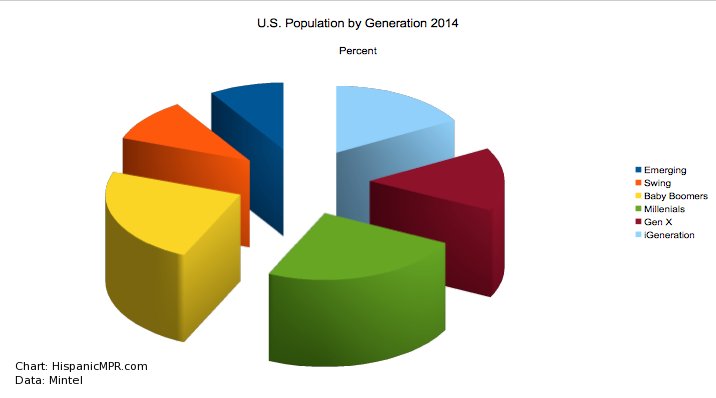
U.S. Population by Generation Percent – 2014 – click to enlarge image
In 2014, there were 78.3 million Americans aged 20 to 37. This market segment, often described as Millennials, represents a quarter of the country’s population. Almost one in five (19.4 percent) Millennials is Hispanic, 14.8 percent is Black, and 5.2 percent is Asian, making the group among the most diverse, according to Marketing to Millennials US February 2014 Executive Summary, a Mintel report.
While Baby Boomers protect their private data, 60 percent of Millennials who responded to Mintel questions said they would be willing to provide details about their personal preferences and habits to marketers. Even for private information these young adults are open minded. Among respondents to the Mintel questions, 30 percent of Millennials said they would share personal information in exchange for a financial incentive such as a $10 discount. Only 13 percent of Baby Boomers who answered the question said they would be willing to do the same.
“Millennials are predisposed to share their personal habits and contact information with marketers, but they do so only when the perceived benefits outweigh the risks. Given that their generation accounts for nearly a quarter of the population, the implications for businesses are tremendous, because as Millennials go, so goes the US economy,” said Fiona O’Donnell, category manager, retail, multicultural, lifestyles and leisure, Mintel, in a press release.
Millennials said they are more likely to share cell numbers and social media profiles with companies than Baby Boomers (30 percent compared to 14 percent and 27 percent compared to 10 percent, respectively). Baby Boomers said they were more willing to share a mailing address, 40 percent versus 38 percent of Millennials. For the most private information, credit scores, 17 percent of Millennials and 8 percent of Baby Boomers were willing to provide the information.
The generational groups represented in the Mintel report are Baby Boomers (23.6 percent), Emerging (9 percent), Gen-X (15.4 percent), iGeneration (16.9 percent), Millenials, Swing (10.5 percent). Baby Boomers are aged 50 to 68, Emerging are under seven years old, Gen-X is 38 to 49, iGeneration is seven to 19, and Swing are 69 and older.
Posted by Elena del Valle on February 5, 2014
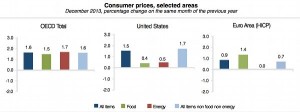
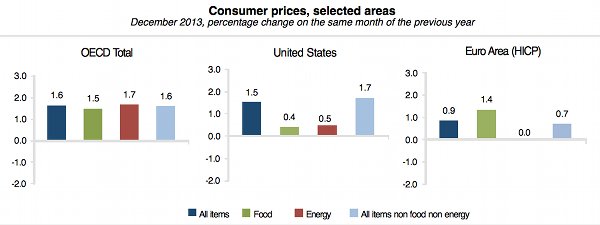
Consumer prices, selected areas December 2013, percentage change on the same month of the previous year – click to enlarge
Image: Organization for Economic Co-operation and Development (OECD)
Annual inflation rose in the United States to 1.5 percent up from 1.2 percent, according to Organization for Economic Co-operation and Development (OECD) figures released this week. In Canada, the change was 1.2 percent in December 2013 up from 0.9 percent in November 2013 while in Germany it went to 1.4 percent up from 1.3 percent; and Japan it went to 1.6 percent up from 1.5 percent. It remained at 0.7 percent in France and Italy and dropped in the United Kingdom to 2 percent down from 2.1 percent. The overall Euro area annual inflation increased to 0.9 percent in December, compared with 0.8 percent in November.
In the OECD area, consumer prices went up by 1.6 percent in the year to December 2013, compared with 1.5 percent in the year to November 2013. This minor increase in the annual rate of inflation was driven for the most part by energy prices which increased by 1.7 percent in the year to December, compared with stable prices in November. The annual price inflation of food was steady at 1.5 percent in December. The OECD annual inflation rate excluding food and energy was also stable at 1.6 percent in December.
The OECD tracks changes in developed countries and provides a forum for member governments to compare policy experiences, search for answers to common problems, identify good practices and coordinate domestic and international policies.
Posted by Elena del Valle on January 1, 2014

Wishing you a New Year filled with health, joy and prosperity.
Posted by Elena del Valle on December 2, 2013

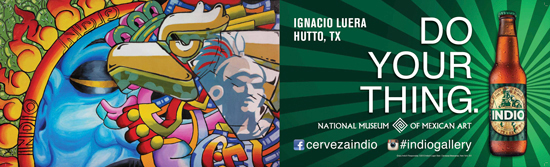
The Indio billboard by Arturo – click to enlarge
Photos: Heineken USA
Heineken owned beer brand Indio marketers created a billboard campaign to reach target consumers, bicultural Hispanic millennials 21 years of age and older “who consider themselves to be original individuals and place an importance on expressing themselves through everything they do, whether it’s art or music.” They invited artists in several states to submit art around an Indio bottle theme to compete. At the conclusion, a few winners had their artwork displayed on billboards as part of the campaign.

The Indio bottle

The Indio billboard by Saul
Company representatives promoted the Indio Gallery campaign across digital media, with heavy emphasis on Facebook. The brand’s Facebook page (Facebook.com/IndioBeer) was the primary gate for consumers to submit their Indio themed artwork. Each entry from among the hundreds of submissions was judged on creativity, originality, composition and inclusion of Indio brand imagery such as the Indio logo or colors.

The Indio billboard by Benjy

The Indio billboard by Ignacio
Nine artists were invited to participate in the campaign. Inspire, Indio’s Dallas advertisement agency, developed 47 billboard ads with the artwork. MediaVest’s MV42, the brand’s media agency, placed them.
Each artist is credited for his work on the billboards, which feature their name and hometown, as well as the brand’s tagline, beer bottle and Facebook address.
The billboards were on display for four weeks in the Chicago, California, and Texas markets in October 2013. Grand Prize winner Arturo Rios received a $5,000 cash prize.

Gustavo Guerra, brand director, Tecate, Indio and Bohemia brands
“Public relations efforts generated coverage across media consumed by our target, while our panel of judges promoted the contest amongst their networks via social media and flyers,” said Gustavo Guerra, brand director, Tecate, Indio and Bohemia brands, by email, in response to questions about promotion and coverage. “We looked at the number of entries we received, as well as engagement on our Facebook page and paid media.”

Indio billboard by Nasim

Indio billboard by Ricardo
The judges, who were compensated for their time, were Gil Cerezo (the lead singer of Mexican band Kinky), Diana Garcia (a Mexican illustrator and actress), Federico Archuleta (an Austin street artist), Juan Angel Chavez (a Chicago artist), the president of the National Museum of Mexican Art in Chicago, and the Indio brand team. The Indio Gallery contest was open to residents of California, Texas and Illinois, the states in which the company launched Indio in 2012. Indio is also distributed in Phoenix and Las Vegas. The resulting billboards were placed across key cities in those markets in October 2013.
Indio is imported from Mexico. A company representative declined to disclose the number of bottles sold in the United States per year or the percent of the Hispanic market segment among fans of the beer brand. Launched in 1893 under its flagship brand, Cuauhtémoc beer, the label featured an Aztec emperor. Consumers nicknamed it the “beer of the Indian.” This led to the current name, which is Spanish for Indian, in 1905.
Posted by Elena del Valle on November 18, 2013
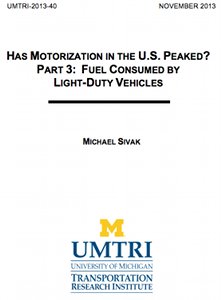
U.S motorization study by Michael Sivak
In 2011, based on the most recent data available, the average driver in the United States consumed 585 gallons of fuel or 1,033 gallons per household. Recent studies indicate that Americans, in general, own fewer light-duty vehicles, drive each of them less, and consume less fuel than in past years.
According to the results of a study (one of three on the subject conducted) released this month, researchers believe fuel consumption rates per person, per licensed driver, per household, and per registered vehicle and distance-driven rates peaked in 2003 or 2004, before the ongoing economic downturn.
By 2011, they had decreased by 13 percent to 17 percent. The researchers believe the long term peak was reached around 2003 or 2004.
They concluded Americans drive fewer light-duty vehicles, defined as cars, pickup trucks, SUVs, and vans; they drive each of them less, and consume less fuel. They also estimate that current fuel consumption rates are lower than they were in 1984 when they began to track the information.
The 17-page report, titled Has Motorization in the U.S. Peaked? Part 3: Fuel consumed by light-duty vehicles was authored by Michael Sivak, director, Sustainable Worldwide Transportation, University of Michigan Transportation Research Institute. Earlier this year, he published two reports in which he looked at recent trends in the numbers of registered light-duty vehicles in the United States and the corresponding distances driven.
Posted by Elena del Valle on October 14, 2013
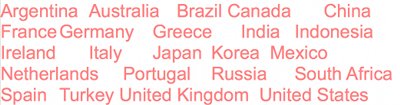
Three researchers examined TIGER indexes for 23 countries
Is the world economy improving? Yes, sort of. After examining key economic indicators of a group of advanced and emerging markets three researchers concluded the economic turn around remains slow and uncertain. Eswar Prasad, Karim Foda and Arnav Sahu, authored the October 2013 Update to TIGER: Tracking Indexes for the Global Economic Recovery published this month by The Brookings Institution and the Financial Times.
Growing confidence in advanced economies and stable growth in emerging markets are driving the economic climate. The analysts are convinced that the economy “remains just a shock or two away from turning into another slump.”
They shared TIGER indexes for 23 countries and charts for the indicators indexes, each including real activity, financial and confidence indicators. The countries are Argentina, Australia, Brazil, Canada, China, France, Germany, Greece, India, Indonesia, Ireland, Italy, Japan, Korea, Mexico, Netherlands, Portugal, Russia, South Africa, Spain, Turkey, United Kingdom and United States.
The Overall Growth Index, the Real Activity Index and other charts for the United States, for example, show a deep slump in 2009 with varying degrees of recovery since. The confidence index was the most worrisome.
It appears the worst is over for advanced economies including Europe, Japan, United States, and United Kingdom. The latter “is experiencing surprisingly good growth.” Overall in advanced economies although jobs creation is weak and financial conditions are mixed confidence in the private sector has increased and inflation is modest. We’re not out of danger, seems to be the cautionary message which points to the need for growth.
At the same time, emerging market economies, such as China, India and Brazil, which had stopped growing are looking stronger. Private sector confidence in these countries had been poor recently and has improved somewhat.
Eswar Prasad is senior fellow, Global Economy and Development
new century chair in International Trade and Economics. Karim Foda is research associate, Global Economy and Development,
and Arnav Sahu is a student at Cornell University.


(3) non-profit organization working to protect Florida’s springs through sound science and education")


 International")

