Posted by Elena del Valle on June 4, 2015

Temple Northup, Ph.D., assistant professor, University of Houston
Photo: University of Houston
Two academics who studied the effects of media in the United States and Austria believe longterm exposure to news may influence racial bias. The results of their three studies were recently published in a 20-page article titled Effects of Long-Term Exposure to News Stereotypes on Implicit and Explicit Attitudes in the International Journal of Communication.
Temple Northup, assistant professor at the University of Houston’s Jack J. Valenti School of Communication, conducted the United States portion of the study while Florian Arendt at the University of Munich in Germany conducted the research in Austria. The study in the United States focused on possible bias toward African-Americans while the two studies in Austria addressed possible bias against foreigners. The researchers believe the influence of television news was likely greater than print news among study participants.
“The two countries were selected due to access of available data for a comparable news stereotype that exists in both countries,” said Northup in a press release. “In the U.S., a large body of research indicates crime is overrepresented on local television news relative to the actual amount of crime that actually occurs in a community. Previous content analyses conducted by researchers at the University of Michigan and the University of California, Santa Barbara have shown that that African-Americans are overrepresented as criminals on local television news when compared to their actual crime rates. In Austria, research has suggested foreigners are overrepresented as criminals in tabloid-style daily newspapers.”
In the first study in the United States 316 participants completed the Implicit Association Test (IAT), a controversial tool used in psychology to measure hidden bias people may have but are unwilling or unable to report. After completing the IAT, participants answered a question about their explicit (conscious) attitudes towards African-Americans, as well as how many hours of local television news they watch per day.
“The two countries were selected due to access of available data for a comparable news stereotype that exists in both countries,” said Northup. “In the U.S., a large body of research indicates crime is overrepresented on local television news relative to the actual amount of crime that actually occurs in a community. Previous content analyses conducted by researchers at the University of Michigan and the University of California, Santa Barbara have shown that that African-Americans are overrepresented as criminals on local television news when compared to their actual crime rates. In Austria, research has suggested foreigners are overrepresented as criminals in tabloid-style daily newspapers.”
There were 489 participants in the first Austria study for which researchers used the same data procedure. Respondents reported how many days per week they read the specific newspaper under investigation. The researchers concluded that exposure to the tabloid-style daily newspaper did not increase the negativity of implicit attitudes. There were 470 participants in the second Austria study. The academics concluded that reading content specifically about crime had a significant effect on implicit attitudes toward foreigners among respondents who said they often read crime articles.
While stereotyping, prejudice, and discrimination are found across the world the impact of media on consumers remains to be clearly defined. The researchers concluded more studies are necessary to better understand the issues “before an earnest attempt to reduce these negative outcomes can be undertaken.”
Posted by Elena del Valle on April 22, 2015
Click to enlarge
Image: No More
According to No More 12.7 million people are physically abused, raped or stalked in one year. Believing there is a strong and compelling need to better understand how these issues impact Latinos, and that Casa de Esperanza is the leading Latino organization in the country dealing with the issues of domestic violence and sexual assault, No More and Casa de Esperanza National Latino Network approached the Avon Foundation for Women to fund a survey on the subject.
Although they declined to disclose the cost, they believe it is the largest and most comprehensive study of domestic violence and sexual assault in the United States Latino community. The results were released this week in the No Mas Study: Domestic Violence and Sexual Assault in the U.S. Latino Community.
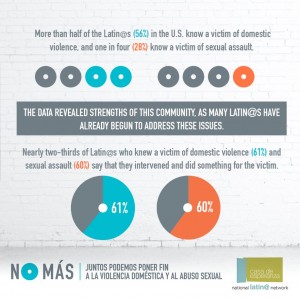
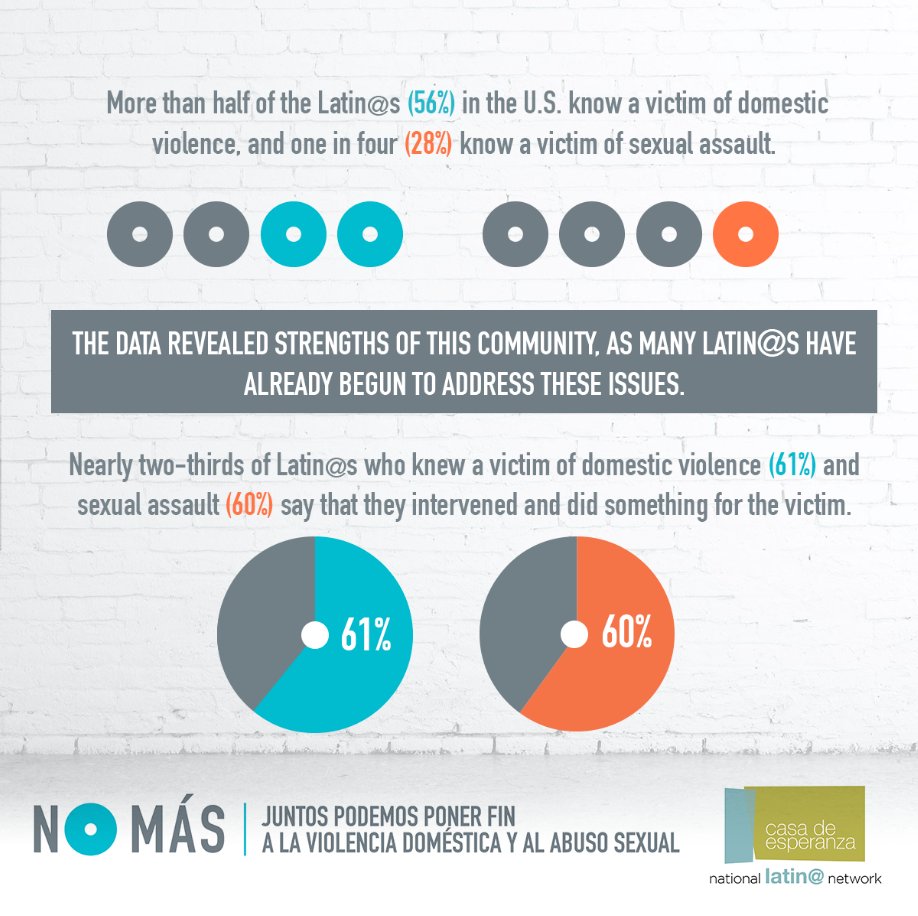
More than half of the Latino respondents, (56 percent) said they know a victim of domestic violence and 28 percent said they know a victim of sexual assault. Among survey takers, 41 percent said they believe that fear of deportation is the main barrier preventing Latino victims from seeking help; 39 percent said they thought the fear of more violence and 39 percent said they thought the fear of children being taken away were the top barriers for victims.
According to the survey, parents who responded are much more likely than parents in the United States population at large to talk to their children about domestic violence and sexual assault. More than half (54 percent) of respondents said they have talked to their children, while only 29 percent of parents in the population at large responding to a 2013 No More study said they had talked to their children about those issues.
The survey results have led the organizations to conclude Latino respondents were addressing domestic violence and sexual assault issues since 61 percent of them who said they knew a victim of either also said they intervened and did something for the victim. Lake Research Partners designed and administered a telephone survey of 800 adult Latinos nationwide conducted between January 27 and February 10, 2015. Among those surveyed 30 percent were interviewed in Spanish. The margin of error for the total sample is +/- 3.5 percent.
National Latino Network for Healthy Families and Communities is a project of Casa de Esperanza, a national institute on domestic violence in Latino communities. Casa de Esperanza has worked for 30 years to mobilize Latino communy to end domestic violence. According to the No More website, No More it is a collaboration of many groups working through a fiscal sponsor, the Joyful Heart Foundation, a registered 501c3. The organization’s goald is to raise awareness nationally and bring people, organizations and advocates together “to help gradually shift perceptions, normalize conversations and engage bystanders to take action to prevent and ultimately end domestic violence and sexual assault.”
The Avon Foundation for Women is one of the world’s largest corporate-affiliated philanthropy organizations “focused on issues that matter most to women.” Through 2014, Avon global philanthropy, led by the Avon Foundation, has contributed nearly $1 billion in over 50 countries. Today, Avon philanthropy focuses on funding breast cancer research and advancing access to quality care through the Avon Breast Cancer Crusade, and efforts to reduce domestic and gender violence through its Speak Out Against Domestic Violence program.
Posted by Elena del Valle on December 23, 2014

As the year draws to a close and a new one approaches we take the opportunity to thank you for your loyal following, your emails and Tweets, comments, ideas and suggestions, and working with us to make our content interesting and relevant. May you and yours have a joy filled holiday season and a happy, healthy and prosperous 2015!
Posted by Elena del Valle on September 30, 2014
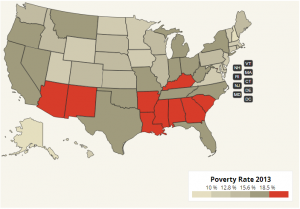
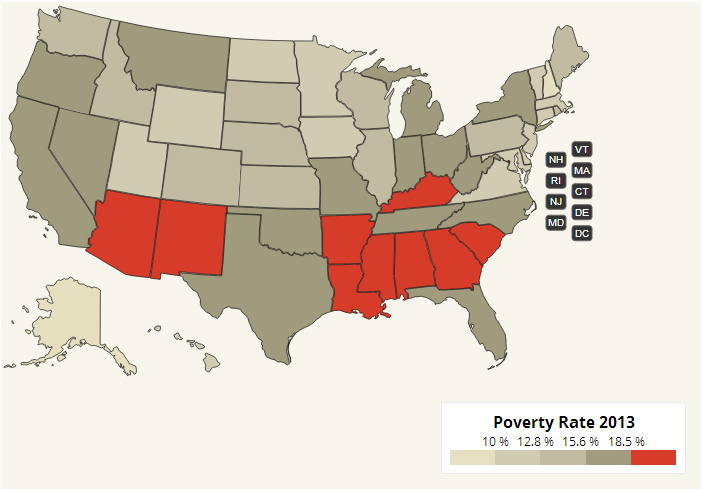
Talkpoverty Map – click to enlarge
Map: TalkPoverty.org
Rising stocks lifted household wealth 1.7 percent, according to the Federal Reserve, to $81.5 trillion between April and June of this year (see Household Net Worth Has Rebounded, The New York Times September 19, 2014 and Americans’ net worth climbs to record high, Associated Press, September 18, 2014). The numbers don’t account for inflation. They were adjusted for the change in the Consumer Price Index.
Household wealth reached a record high, 4 percent above the 2007 figures. The improvement in household wealth is especially evident among the wealthiest households. While the net worth of some Americans reached a record high poverty remains elevated, and there was an increase in new debt, mostly from auto and student loans.
Using data released by the U.S. Census Bureau, TalkPoverty.org, a project of the Center for American Progress’s Half in Ten Education Fund, recently released an interactive state by state map with congressional district level poverty data for 2013 designed to showcase the impact of poverty across the nation. It can be found at http://talkpoverty.org/poverty/
The tool relies on seven key indicators: the total poverty rate; the women in poverty rate; the child poverty rate; and the poverty rate among African Americans, Asian Americans, Native Americans, and Latinos. It also includes a ranking of states’ total poverty rates and child poverty rates.

Greg Kaufmann, editor, Talkpoverty.org
“We haven’t made nearly enough progress to reduce poverty nationwide, and both low- and middle-income families are still struggling to recover from the Great Recession,” said Greg Kaufmann, editor of TalkPoverty.org and senior fellow with the Half in Ten Education Fund, in a press release. “At the state and local levels, we see the disparate impact of poverty, particularly among women and communities of color. The latest round of Census data sheds light on the reality of poverty in our own backyards, and should be a wake-up call to policymakers that we can and must do more to drastically reduce poverty.”
The Center for American Progress suggestions to reduce poverty, boost economic security, and expand the middle class include raising the minimum wage; increasing the Earned Income Tax Credit, or EITC, for childless workers; supporting equal pay; providing paid leave and paid sick days; investing in affordable, high-quality child care and early education; and expanding Medicaid.
Launched in May 2014, TalkPoverty.org is an online hub dedicated to “providing in-depth analysis and educational resources about poverty in America and what we can do at the local, state, and federal level to dramatically reduce it.”
Posted by Elena del Valle on September 24, 2014

Rintaro Tamaki, deputy secretary general, OECD
Photo, graphic: OECD/Michael Dean
Most major advanced and emerging economies are experiencing a moderate if uneven expansion across regions; and growth is weak in the euro area, which may suffer prolonged stagnation unless something happens to boost demand, according to the Organisation for Economic Co-operation and Development’s (OECD) most recent Interim Economic Assessment.
In the United States, the United Kingdom and Canada, the researchers believe growth will be cause unemployment to drop. In Japan, where unemployment is already low, the economy may grow broadly. They believe China will to continue experiencing high yet more sustainable growth rates while India and Brazil rebound from the recession.
“The global economy is expanding unevenly, and at only a moderate rate,” said Rintaro Tamaki, deputy secretary general and acting chief economist, OECD, at the Interim Economic Assessment in Paris, France, according to the OECD website. “Trade growth therefore remains sluggish and labour market conditions in the main advanced economies are improving only gradually, with far too many people still unable to find good jobs worldwide. The continued failure to generate strong, balanced and inclusive growth underlines the urgency of undertaking ambitious reforms.”

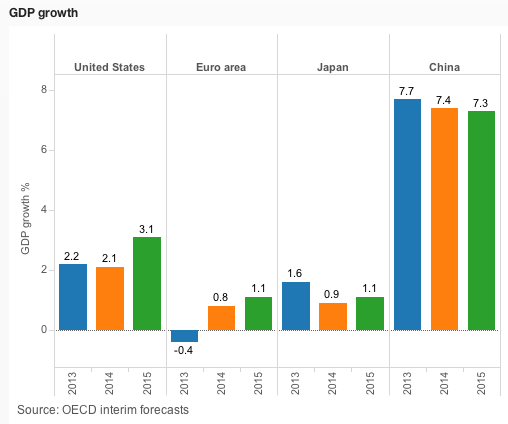
OECD Projected GDP Growth 2014-15 – click to enlarge
The OECD projects that in 2014, the United States will grow by 2.1 percent, and by 3.1 per cent in 2015; the United Kingdom will grow by 3.1 percent in 2014 and 2.8 percent in 2015; and Canada will grow 2.3 percent this year and 2.7 percent in 2015.
They estimate Japan will grow by 0.9 percent in 2014 and 1.1 percent in 2015; the euro area will grow at a 0.8 percent rate in 2014 and a 1.1 percent pace in 2015.
Growth prospects differ widely among the major euro area economies. The researchers forecast Germany will grow by 1.5 percent in 2014 and 2015, France by 0.4 percent in 2014 and 1 percent in 2015, while Italy will see a -0.4 percent drop in 2014 and a gain of just 0.1 percent in 2015.
Posted by Elena del Valle on August 13, 2014
Photo: U.S. Census Bureau, Public Information Office (PIO)
Unsure about your race or ethnicity? You’re not alone. Almost 10 million (9.8 million) people varied their ethnicity responses between the 2000 and the 2010 censuses. That represents 6 percent of the population of 168 million who changed their minds about their identity between the two national demographic surveys, according to Preliminary Results from America’s Churning Races: Race and Ethnic Response Changes Between Census 2000 and the 2010 Census.
The shift may be explained at least in part due to questionnaire design changes, the report indicates. Analysts observed a race response change among American Indians, Alaska Natives, Native Hawaiians and Other Pacific Islanders, people who reported multiple races, and Hispanics who reported a race. The researchers found little variation among single race non Hispanic whites, blacks, and Asians.
“Compared to adults, children and adolescents may be more likely to change their race/Hispanic responses for two reasons: childhood and adolescence are times of personal identity development and young people’s information was probably reported by their parents in 2000 but may be self-reported in 2010,” researchers said.
The most common change in responses was from Some Other Race (SOR) to single race white among those who identified (or were identified by someone in the household) as Hispanic in both the 2000 and the 2010 censuses. The second most common response change was from single race white to SOR for those who reported (or were reported as) Hispanic in the two censuses.
Specifically, 710,019 respondents changed from white to Hispanic white, and 417,855 changed from Hispanic white to white between one census and the next, according to an Associated Press article (10 million switched ethnicity or race ID on census forms by Jesse J. Holland). Races in the Census are white; black or African American; American Indian or Alaska Native; Asian; Native Hawaiian or Other Pacific Islander; and other for those with more than one race. In addition, there is a Hispanic ethnic category. The article also pointed to people who were children and or living in the West when the 2000 Census took place as the most likely to have modified their responses between the government surveys.
The paper was authored by Sonya Rastogi, PhD, Senior Researcher, Center for Administrative Records Research and Applications (CARRA), Carolyn Liebler, PhD, Assistant Professor of Sociology, University of Minnesota, Leticia Fernandez, PhD, Researcher, CARRA, and James Noon, Researcher, CARR.
Posted by Elena del Valle on June 19, 2014

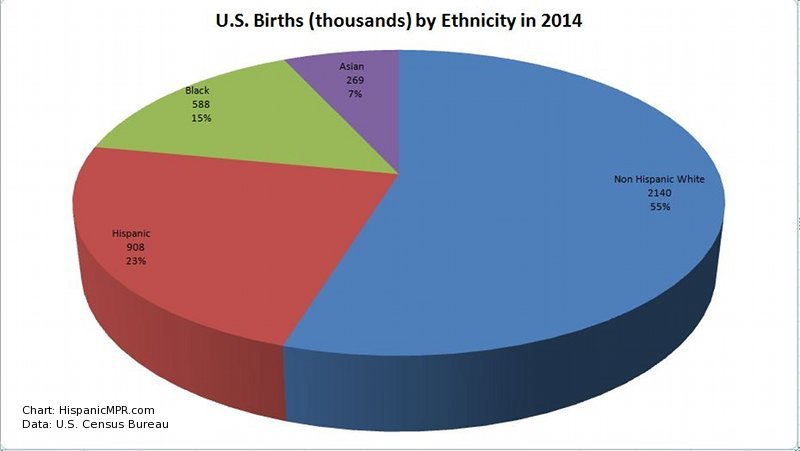
U.S. Births in 2013 by Ethnicity – click to enlarge
What’s the opposite of a baby boom (as in the Baby Boomer Generation)? A baby bust. Last year, 281,000 fewer babies were born than the United States Census Bureau had projected. Instead of 4,238,995 births there were only 3,957,577.
As a result of the bust, non Hispanic whites, with 54 percent of new babies, represent the majority of births. The Census Bureau anticipated only 49 percent of babies would be non Hispanic white.
In 2013, more non Hispanic white babies were born than the Census Bureau had projected. That is 2,140,272 rather than the projected 2,077,212 babies were born. On the other hand, 19 percent fewer Hispanic women gave birth than the Census Bureau had projected. Less than one million (907,859) babies were born to Hispanic mothers instead of the projected 1,122,069.
Following are the 2013 births and percent distribution by race and ethnicity: Asian 268,559 (6.8 percent), Black 587,612 (14.8 percent), Hispanic 907,859 (22.9 percent), and Non Hispanic white 2,140,272 (54.1 percent), according to American Consumers Newsletter June 2014.
Posted by Elena del Valle on May 8, 2014

In 1914, Congress designated the second Sunday in May as Mother’s Day thanks to the efforts of Anna Jarvis, who first organized observances in Grafton, West Virginia, and Philadelphia on May 10, 1908. Four million (4.1 to be exact) women between the ages of 15 and 50 gave birth in the past 12 months, according to U.S. Census Bureau, 2012 American Community Survey (Table B13002).
Almost half of women (47 percent) between 15 and 50 had no children. One in five women in the same age range had two children, 17 percent had one, 10 percent had three and about 5 percent had four or more, according to Fertility of American Women: 2010 (Detailed Tables, Table 1).
In 2012, the average age of women when they had their first child was 25.8 up from 25.6 years the previous year. There was a relatively large decline in births to women in their teen years and their twenties. Jacob and Sophia were the most popular baby names that year.
Less than one third of new mothers (29.5 percent) had a bachelor’s degree or higher while 84.6 percent of said they have at least a high school diploma (source: 2012 American Community Survey, American FactFinder, Table S1301).
In 2011, 35.7 percent of births were to unmarried women age 15 to 50. The metro areas with birth rates to unmarried mothers that were among the highest in the country included Flagstaff, Arizona (74.6 percent), Greenville, North Carolina. (69.4 percent), Lima, Ohio (67.5 percent), Myrtle Beach-North Myrtle Beach-Conway, South Carolina (67.4 percent) and Danville, Virginia. (67.3 percent).
In 2013, there were five million stay at home moms or about the same percent as in the previous two years. That year, almost one quarter (24 percent) of married couple families with children under 15 had a mother at home, up from 21 percent in 2000.
In 2011, Mother’s Day was described as the largest card sending and money sending occasion for United States Latinos of the year, according to a Univision article by Graciela Eleta. She believed that many Latinos who leave their mothers behind when they immigrate take advantage of Mother’s Day to send greeting cards and money transfers (funds are double those of an average month) to their mother in their country of origin.
In 2011, there were 63 births per 1,000 women ages 15 to 44, a low number, led by the drop in births among immigrant women. In 1957, by comparison, it peaked at 122.7 births per 1,000 women of childbearing age. The recent decline in birthrates was greatest, 25.7 percent, among Mexican American women and Mexico born women, according to a 2013 Herald Tribune article (Hispanic pregnancies fall in U.S. as women choose smaller families) that cites Pew Research Center data. In 2010, Hispanic birthrates reached the lowest level in 20 years, according to Pew data.
Posted by Elena del Valle on April 2, 2014

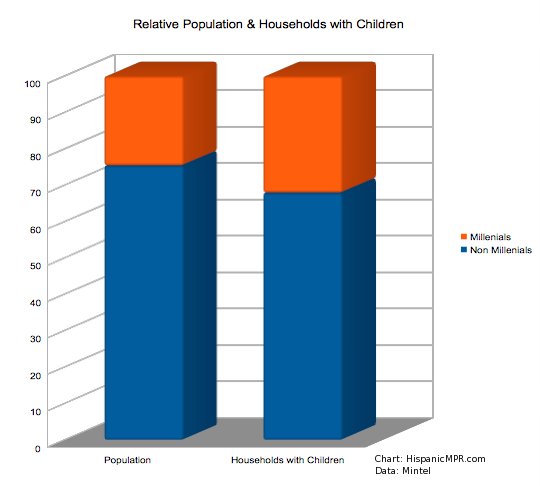
2014 Relative Population & Households with Children – click to enlarge
In the United States, two thirds of Millennials have never been married, according to Marketing to Millennials US February 2014 Executive Summary, a Mintel report. Those who got hitched are in their late twenties. The median age for first marriage is about 29 for men and 27 for women. Thirty-two percent of households with children are Millenial households. At the same time, 43 percent of Millenial households include children.
Although 25 percent of Millenials 25 and older have a bachelor’s degree and 9.5 percent have a graduate degree compared to 11.1 percent of all adults, unemployment among that market segment is higher than for the national average. At the time of the report, 10.3 percent of Millennials between 20 and 24 years old, and 6.8 percent of Millennials aged between 25 and 34 were unemployed. The national unemployment average is 6.5 percent.
There’s a notable difference in household income between younger and older Millenials. While Younger Millennials, those under 25 years of age, have a median household income of $30,604, the median income of Older Millennials, those 25 and older, is about $51,381. The former may be still be studying or in an entry-level job, whereas Older Millennials may be working full-time and more advanced in their career. Mintel researchers believe the 2008 financial crisis caused median income for those aged 15-24 to decline 13 percent between 2007 and 2012, and decline 9 percent for adults aged 25-34.
At the same time, annual spending for Younger Millennials is 40 percent less than for all adults, while among Older Millennials, average expenditures are about 4 percent less. Younger members of the market segment spend less on everything except education. Older Millennials spend a good deal more than all adults on alcoholic beverages and apparel and services, and significantly less on healthcare.
Posted by Elena del Valle on March 20, 2014

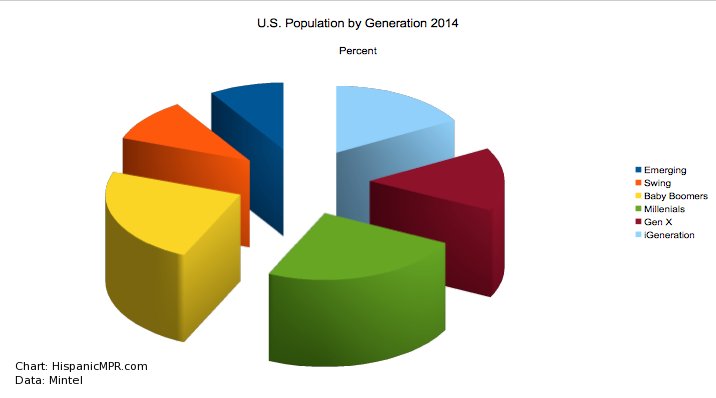
U.S. Population by Generation Percent – 2014 – click to enlarge image
In 2014, there were 78.3 million Americans aged 20 to 37. This market segment, often described as Millennials, represents a quarter of the country’s population. Almost one in five (19.4 percent) Millennials is Hispanic, 14.8 percent is Black, and 5.2 percent is Asian, making the group among the most diverse, according to Marketing to Millennials US February 2014 Executive Summary, a Mintel report.
While Baby Boomers protect their private data, 60 percent of Millennials who responded to Mintel questions said they would be willing to provide details about their personal preferences and habits to marketers. Even for private information these young adults are open minded. Among respondents to the Mintel questions, 30 percent of Millennials said they would share personal information in exchange for a financial incentive such as a $10 discount. Only 13 percent of Baby Boomers who answered the question said they would be willing to do the same.
“Millennials are predisposed to share their personal habits and contact information with marketers, but they do so only when the perceived benefits outweigh the risks. Given that their generation accounts for nearly a quarter of the population, the implications for businesses are tremendous, because as Millennials go, so goes the US economy,” said Fiona O’Donnell, category manager, retail, multicultural, lifestyles and leisure, Mintel, in a press release.
Millennials said they are more likely to share cell numbers and social media profiles with companies than Baby Boomers (30 percent compared to 14 percent and 27 percent compared to 10 percent, respectively). Baby Boomers said they were more willing to share a mailing address, 40 percent versus 38 percent of Millennials. For the most private information, credit scores, 17 percent of Millennials and 8 percent of Baby Boomers were willing to provide the information.
The generational groups represented in the Mintel report are Baby Boomers (23.6 percent), Emerging (9 percent), Gen-X (15.4 percent), iGeneration (16.9 percent), Millenials, Swing (10.5 percent). Baby Boomers are aged 50 to 68, Emerging are under seven years old, Gen-X is 38 to 49, iGeneration is seven to 19, and Swing are 69 and older.


(3) non-profit organization working to protect Florida’s springs through sound science and education")


 International")

