Posted by Elena del Valle on August 19, 2010
We recently found out by a comment from an audience member and then an email reply to Harald Vogt’s email address of his passing. The email said, “Caroline Pieper-Vogt and the family of Harald Vogt regret to inform you of Harald’s recent passing. All Scent Marketing Institute projects, newsletters and events are on hold until further information is available. The Vogt family thanks all for their help and support.” Although a phone call was unanswered we confirmed the news online at Tributes.com, http://www.tributes.com/show/Harald-Vogt-89044965
Earlier this year Harald contributed two Guest Articles to HispanicMPR. In addition HispanicMPR is a Media Partner to The Scent Marketing Institute’s Scent World 2010 event November 17-19, 2010 on Miami Beach, Florida. We extend our condolences to his family and friends.
Posted by Elena del Valle on August 18, 2010

Spanish language signage at a cell phone store
Photos: AT&T, Sony
A bird’s eye view of Latinos across the country reveals lower use of technology than that of non Latinos. Also, age and language preference are indicators of technology use. Older Latinos rely on technology less than young ones. Spanish dominant Latinos use of technology is lower than that of English dominant and bilingual Latinos.
More than two thirds (78 percent) of non Latino adults (18 and older) go online compared to 64 percent of Latinos of the same age; and 86 percent of non Latinos use cell phones while 76 percent of Latinos use cell phones.
At the same time, when it comes to the use of technology not all Latinos are equal. United States born Latinos use of the internet and cell phones is higher than that of foreign born Latinos. Latinos born in the United States are much more likely to use technology, especially the internet, than foreign born Latinos, according to a Pew Hispanic Center report released recently. The report, written by Gretchen Livingston, senior researcher, Pew Hispanic Center points to a significant difference between the two groups. The Pew Hispanic Center is a research organization that seeks to improve understanding of the U.S. Hispanic population.
For example, 85 percent of Latinos 16 and older born in the United States rely on the internet while only 51 percent of their foreign born counterparts surf the digital world. When it comes to cell phone use the difference is less marked: 80 percent of United States born Latinos use a cell phone while 72 percent of foreign born Latinos do so.

Sony Vaio J computer
If we look at technology use among young people in the United States the difference is also clear. Nearly all (96 percent) non Hispanic youth between 18 to 25 years of age surf the internet while only 77 percent of Hispanics go online. Eighty-two percent of non-Hispanics ages 16 and 17 use a cell phone while 72 percent of Hispanics of that age do so. Ninety-four percent of non Hispanics aged between 18 and 25 use a cell phone compared with eighty percent of Hispanics.
If we look at technology use among people 55 and older, there is still a difference between Latinos and non Latinos. Among non Latinos 75 percent use cell phones and 57 percent use the internet while only 60 percent of Latinos in that age group use cell phones and 42 percent use the internet.
When it comes to going online language preference is a key factor. A majority of English dominant (87 percent) Hispanics 16 and older and bilingual (77 percent) Hispanics are more likely to use cell phones than Spanish dominant Latinos (35 percent).
This report was based primarily on the 2009 National Survey of Latinos, conducted from August 5 through September 16, 2009 among a randomly selected, nationally representative sample of 2,012 Hispanics ages 16 and older. The survey was conducted in English and Spanish on landline and cellular phones.
Posted by Elena del Valle on August 17, 2010
WiredLatinos Directory, owned by Mygritomedia LLC, a new online directory offering paid and free listings, added HispanicMPR.com to its directory. WiredLatinosDirectory.com was launched by WiredLatinos.com.
According to the website, the directory is edited by humans. Company executives hope to compile “the most comprehensive list of Latino owned, managed, targeted and community serving websites.” See the HispanicMPR.com listing at http://www.wiredlatinosdirectory.com/hispanicmpr-com/
Posted by Elena del Valle on August 16, 2010
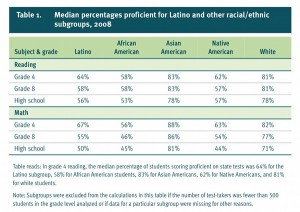
Reading, math scores by race/ethnicity – click to enlarge
Chart, photo: Center on Education Policy, CommunicationWorks
A colleague pondered out loud the other day: “In future decades how will marketers target America’s increasingly large emerging markets?” Although Asian American students are doing better than their emerging market counterparts, reading (and math) proficiency is low among Latinos and blacks compared to other students. If the young adults of the future can’t read will general marketing emphasize the visual and audio formats that they are able to consume?
In spite of some modest gains in test scores among Latinos in recent years, education gaps appear to be a serious problem that is not going away anytime soon. According to a recent report on Latino performance in school, in California, the state with the largest Latino enrollment, Latino students were the lowest-performing subgroup in reading at all grade levels.
On the last day of June 2010 the Center on Education Policy (CEP) released a series of reports on the performance of Latino, African American, Asian American, Native American and white students on state reading and math tests. The reports also examine the implications of CEP’s findings about achievement for each ethnic/racial subgroup.
Although Latinos still perform well below Asian American and white students on state tests and many issues remain to be resolved when it comes to education, especially in states with a high percentage of Latinos, according to the results of the reports, some Latino students are performing better on state reading and math tests than in the past.
Between 2002 and 2008 for grades four, eight and the high school grade assessed for the No Child Left Behind (NCLB) Act the performance of Latino students on state reading and math tests improved in most states.
At the same time according to the report as a group, African American students were often the lowest-performing racial/ethnic subgroup in 2008 on state reading and math tests at grades four, eight, and the high school tested in the majority of the states with sufficient data, as well as in the nine states with the highest numbers of African American test-takers. In contrast, as a group, Asian American students often outperformed other racial/ethnic subgroups in reading and math at grades four, eight, and the high school grade tested. In high school reading, however, white students did better than Asian American students in most states with sufficient data and sufficiently large Asian subgroups.
Despite gains, the Latino subgroup still remains among the lower-performing racial/ethnic subgroups on state tests. Across all states with adequate data, median percentages proficient for Latino students in reading and math in 2008 were well below those of the Asian and white subgroups. For example, in grade eight math the medians were 55 percent for Latino students, compared with 86 percent for Asian students and 77 percent for white students. Latino students were somewhat above or similar to medians of African Americans at 46 percent and Native Americans at 54 percent.

Jack Jennings, president and CEO, CEP
In 2008, Latino students were the lowest-performing racial/ethnic subgroup in at least one subject/grade combination in 11 states with sufficient data for the study. The achievement for Latino students in 2008 was slightly more negative in the five states that together enroll more than 70 percent of the nation’s Latino students California, Texas, Florida, New York and Arizona.
“These increases in test scores for Latino students are encouraging, but the achievement level of Latino students is nowhere near where it has to be,” said Jack Jennings, president and chief executive officer, CEP. “Latino students are the largest ethnic minority group in many states and are the fastest-growing nationally, and therefore it is crucial to improve achievement for these students.”
CEP analyzed 2008 state test results and trends since 2002 in the Latino-white achievement gap and in the percentages of Latino students reaching various achievement levels. Their findings were drawn from test data, gathered by CEP, from all 50 states.
The Latino student report indicates that states with increases for Latino fourth graders since 2002 outnumbered states with decreases at the basic, proficient, and advanced achievement levels. Latino students have also improved achievement at grades four, eight, and the tested high school at a fast enough rate to narrow gaps in the percentage reaching proficient in reading and math in a large majority of the states with sufficient data. Since 2002 gaps narrowed more often than they widened, according to the mean test scores results.
The researchers concluded that the “relatively low performance of Latino students, who in less than a generation will comprise roughly three in ten American children, is an urgent issue. The nation’s economic and social well-being will be compromised without efforts at all levels of government to develop policies to increase achievement for Latino young people.”
Based in Washington, D.C., and founded in January 1995 by Jack Jennings, the Center on Education Policy is “a national, independent advocate for public education and for more effective public schools.” According to a press release the Center represents no special interests. The Center strives “to help citizens make sense of the conflicting opinions and perceptions about public education and create conditions that will lead to better public schools.”
Posted by Elena del Valle on August 11, 2010

Photos: Babyspot.com, Todobebe.com
Our nation’s birth rate has declined in the past 20 years. During that time period new mothers have become more likely to be older, better educated and less likely to be white. Fewer white women are having babies while an increasing number of babies are born of Hispanic moms, according to a recently released report. One in four births in 2008 was to a Hispanic mother. Although white women still represented more than half of mothers of newborns that year that was less than the 65 percent of white women who gave birth in 1990.
More than half of mothers of newborns in 2006 had spent some time in college which was an improvement over the 41 percent of women who had some college education in 1990. Older mothers of newborns, those 35 years of age and older, were much more likely to have some college education (71 percent).

James Rivera, co-founder, Babyspot
“I do see evidence of your findings, our site agrees with most of your data. Our traffic has increased in the last year, it’s around 30 percent increase,” said James Rivera, co-founder and chief executive officer, BabySpot, Inc. when asked if he sees evidence of these trends.
Women are also waiting longer to have babies than they did twenty years ago. While in 1990, teenagers had a higher share of all births (13 percent) than did women 35 years of age and older (9 percent) by 2008, the reverse was true with 10 percent of births to teens and 14 percent to women ages 35 and older. This increase in older mothers held across ethnic groups.

More unmarried women by far (41 percent) had babies in 2008 than in 1990 (28 percent). Black unmarried women were the most likely to have babies compared white and Hispanics.
“There are 4M (million) births per year and 1M (million) are to Spanish speaking parents, 25 percent of the newborns. This has been a constant for the past two years and is based on U.S. Census Live Birth Statistics,” said Cynthia Nelson of Todobebe.com. “We have a 20 percent increase in moms that join Todobebe in the past year and about 55 percent of our moms are pregnant at any one give time. There is no one month during the year that there are more births with the exception of the slight increase in September (December holidays trigger this event).”
In 2008, there were 4.3 million births in our country slightly more than in 1990 when there were 4.2 million. Between 2003 to 2007 the number of births increased each year and then declined by about 66,000; the researchers believe the decrease is the result of the economic downturn.

Immigrants tend to have higher birth rates than the native born although those rates have declined in recent years. The share of births to foreign-born mothers, 15 percent of U.S. births in 1990, grew 60 percent through 2004. In 2004, births to foreign-born women represented the majority of Hispanic (61 percent) and Asian (83 percent) births.
Although it is hard to think about our nation’s demographic profile in 40 years, according to Pew Research Center population projections and assuming current trends remain steady, 82 percent of the nation’s population growth through 2050 will be produced by immigrants who arrived in our country after 2005 and their descendants. The researchers estimate 142 more million people will fuel our population between 2005 and 2050; of these 50 million will be the children and grandchildren of new immigrants.
The report, The New Demography of American Motherhood, was written by Gretchen Livingston and D’Vera Cohn of the Pew Research Center based on data from the National Center for Health Statistics and the Census Bureau. It also included the findings of a national Pew Research Center survey about parenthood.
Posted by Elena del Valle on August 2, 2010
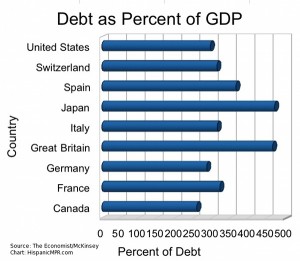
Debt as Percent of GDP – click to enlarge
These days everybody is talking or thinking about debt. The debt of the United States is a concern for many as our country falls deeper into debt to pay off wars and save banks, mortgage companies, car makers and the like from supposed failure. On the other side of the pond European nations like Greece, Portugal, Spain, Italy, and Ireland have been in the news lately due to their precarious debt related status.
The debt of nations is but one part of the problem. Across the west companies and individuals have over extended themselves, borrowing, some believe irresponsibly, in search of ever higher returns in the case of greedy companies and investors. Consumers have gotten into debt to buy bigger cars, houses, trips and some of the many trappings of today’s consumer driven society.
According to a recent an article in The Economist relying on data from the McKinsey Global Institute Ireland and Iceland approached the debt limit of eight and as much as ten times their gross domestic product (GDP). They are the the most noteworthy but not the only ones.
British bank debt as it relates to the country’s economy is significant as is the level of debt of corporations in Spain. The relationship between public and private sectors and debt issues is complex. If the government is needed to hold up companies with too much debt it will have an impact on countries with economies that appear healthy or less at risk than that of their neighbors.
Among countries with high debt to GDP ratios and a worsening outstanding debt compared to economic growth according to the article, Spain has surpassed Greece as the country in the worst position.
What does this mean to the average person in North America and Europe? Debt has caught up with governments, companies and consumers. Things are changing. No spending or cautious spending has replaced over-the-top spending. But astute observers say the many decades of living now with the promise to pay later will have a long term effect. Government promises and private sector conservatism now aren’t enough given that governments are having to come to the rescue of private sector behemoths and in many instances the countries themselves are in turbulent economic waters.
At the same time North America and many nations in Europe have large aging populations in varying proximity to their retirement years. That will mean fewer productive people in the workforce and more retirement dollars and healthcare dollars draining the system during belt tightening times. In all Organization for Economic Cooperation and Development (OECD) countries total spending on healthcare is rising faster than economic growth, causing the average ratio of health spending to GDP to rise 7.8 percent in 2000 to 9 percent in 2008. The causes behind the rising health spending, technological change, population expectations and population aging, are expected to continue to drive costs higher in the future.
In some countries the falling GDP and rising healthcare costs led to a marked increase in the ratio of health spending to GDP. For example, in Ireland, the percentage of GDP assigned to health increased from 7.5 percent in 2007 to 8.7 percent the following year while in Spain the increase was from 8.4 percent to 9 percent for the same years. In 2008, the United States spent $7,538 per person on health more than double the $3,000 average of all OECD countries. Although Norway and Switzerland, the next generous with healthcare budgets, spent 50 percent more than the OECD average.
The solution, some believe, is to grow economies while reducing spending. How will social benefit heavy societies like those in western Europe deal with growth requirements and the debt burden? Will they cut back healthcare, social and retirement benefits?
Entrepreneurs, an important source of future intellectual and financial wealth, may struggle since more than half of all new firms rely on debt finance, according to The Economist. Forward looking analysts indicate that to survive businesses will have to adapt to the economic situation and new mindset. In an ever tighter corporate environment with increased oversight and fewer entrepreneurial windows, it is likely marketers too will need to adjust to the new reality, demonstrating their worth with measurable results.
Posted by Elena del Valle on July 28, 2010
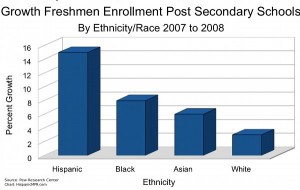
Freshmen Enrollment Growth by Ethnicity/Race – click to enlarge
What are young people in America to do during this recession? Enroll in college. There is a college boom taking place and it is being driven by minorities, according to a recent Pew Research Center
article based on the organization’s analysis of new data from the United States Department of Education.
There was an increase of 144,000 freshman students from the fall of 2007 to the fall of 2008, the first year of the recession, at the nation’s 6,100 post-secondary institutions representing a 6 percent increase, the largest in 40 years. Almost three-quarters of the growth was from minority freshmen.
From 2007 to 2008 although there was only a 3 percent increase in freshman college enrollment of whites, minority enrollment was noteworthy. Hispanics enrollment at post secondary institutions grew 15 percent, blacks enrollment grew 8 percent, and Asian enrollment grew 6 percent.
Of course the growth is not spread evenly across the country. Cities with historically large ethnic, especially Hispanic, populations may have markedly higher increases and an overall higher ethnic presence. An example is South Florida.
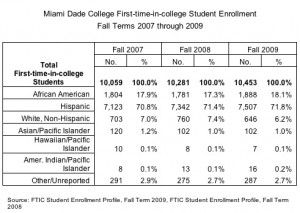
Click on image to enlarge
“MDC’s enrollment growth reflects the community we serve: more than 80 percent of Miami-Dade’s residents are racial or ethnic minorities, with Hispanics predominating. In the 2000 Census 57 percent of Miami-Dade County residents were Hispanic, increasing to 62 percent in the latest estimates. Hispanics at MDC have increased steadily as a proportion of overall student enrollment from 2007 through 2009, and even more so as a percentage of freshman enrollment,” said Margaret Mannchen, associate director, Institutional Research Operations, Miami Dade College, one of the largest post-secondary institutions in the country in both number of students enrolled (170,000) and number of associates degrees awarded
“Now Hispanics are about 72 percent of our first-time-in-college students. Looking at all credit students, we see both African American and White Non-Hispanic percentages declining slightly from Fall 2007 through Fall 2009. In 2009, however, the proportion of African American freshmen was starting to show an increase, after a slight decline in 2008.”
The growth is not surprising given the demographic profile of the United States. As the white population ages it is the minority youth that fuel the nation’s growth. In addition, Census Bureau surveys indicate the Hispanic high school completion rate reached an all-time high of 70 percent in October 2008, a 2.5 percent increase over 2007 and the largest increase of any ethnic or racial group.
Although in the past minority students tended to seek community colleges and trade schools, the growth from 2007 to 2008 was at all basic levels of post secondary education. At the same time, a lower percent of white freshmen enrolled in less-than-four-year schools in 2008 (53 percent) than in 2007 (55 percent); and in four-year schools in 2008 (62 percent) than in 2007 (64 percent).
Of course not all institutions of higher learning showed an increase for that time period. One private university in South Florida had a decrease in enrollment numbers.
“Unfortunately I don’t know that 2008 would be a good bench as nationally there was a decrease in overall enrollment due to the financial crisis and the availability of credit. The numbers picked up again sharply for 2009 and we are currently tracking for 2010 at about a 2-3% increase in enrollment. As I look at the applications coming in we are definitely seeing an increase in minority applications and matriculations,” said Andre Lightbourn, dean, Enrollment Management, Saint Thomas University in Broward County.
“According to our institutional fact book amongst the broad categories Black and Hispanic we are probably about flat for 2007, 2008 & 2009. The numbers have increased for foreigners and other ethnic groups. The number of white students has declined in the same period for the last three academic years 2007, 2008 & 2009.”
An executive summary of the Pew Research Center analysis, written by Richard Fry, was published June 16, 2010. The Pew Research Center, a self described nonpartisan provider of information on “the issues, attitudes and trends shaping America and the world.”
Posted by Elena del Valle on July 21, 2010
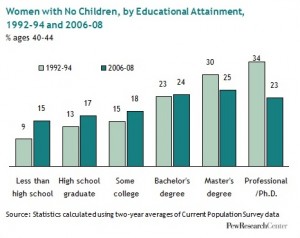
Childless women by educational level – click to enlarge
Graphs: Pew Research Center
In the United States, white women are among all ethnic and racial groups the most likely not to have had a child over the past decade. Over that time period the gap between groups has narrowed with childless rates rising more rapidly for black, Hispanic and Asian women, than for white women. Not surprisingly, women who have never married are most likely to be childless. At the same time, those rates have declined over the past decade and the rate of childlessness has risen for married women and women who were married at one time, according to a recent report from the Pew Research Center.
In 2008, 20 percent or one in every five white women between 40 and 44 years of age was childless. That same year, 17 percent of black and Hispanic women and 16 percent of Asian women in that age group were also without children. Between 1994 and 2008, the rates of childlessness increased more for nonwhites than for whites: the childlessness rates for black women and for Hispanic women went up by more than 30 percent while the increase among white women was 11 percent.
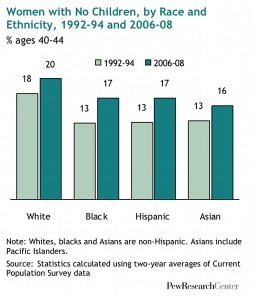
Childless women by race/ethnicity – click to enlarge
This is a sharp contrast to the rates in the 1970s when only 10 percent of white women reached the end of their childbearing years without ever becoming a mother. Although the most educated women are the most likely never to give birth to a child, the exception to the childlessness rates increase was among women with advanced university degrees where the rate fell in the past 10 years. In 2008, 24 percent of women ages 40 to 44 with a master’s, doctoral or professional degree had not had children, a decline from 31 percent in 1994.
The researchers believe childlessness increased for several reasons. Women today endure less social pressure to have children than in past decades. Improved contraceptive methods and better job options for women were also cited as influencing women’s decision to not have children. Women, especially educated women, have delayed marriage and having children, the researchers explain in the report.
Another factor is that some women do not give birth but raise adopted children. In 2008, there were 61.6 million biological children, 1.6 million adopted children and 2.5 million stepchildren in United States homes (2008 American Community Survey).
The report, Childlessness Up Among All Women; Down Among Women with Advanced Degrees, was written by Gretchen Livingston and D’Vera Cohn of the Pew Research Center and released June 25, 2010. They based their findings on Current Population Survey data. The Pew Research Center, a self described nonpartisan provider of information on “the issues, attitudes and trends shaping America and the world.”
Posted by Elena del Valle on June 23, 2010
By Harald H. Vogt
Founder and chief marketer, Scent Marketing Institute

Harald H. Vogt, founder and chief marketer, Scent Marketing Institute
Photo: Scent Marketing Institute
Information transported via our perception of scent does not require translation. There is no “Press 1 for English, 2 for Spanish” when it comes to recognizing the scent of fresh baked bread, ultimately drawing us to it’s source, the bakery on the corner or in the supermarket. Scent can be a guide, or it can create a desire, even an emotion without a word being spoken.
Scents are processed in the limbic system of our brain, which happens to be responsible for the decision-making process and for our emotions. With that “internal wiring” already in place it takes fairly little to trigger a person to react in a certain way.
Click here to read the entire article Scent communication – no language barriers apply!
Posted by Elena del Valle on June 21, 2010
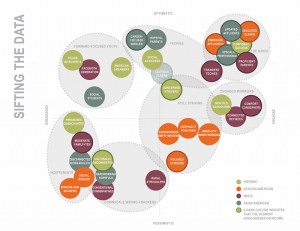
Sifting the Data – click on image to enlarge
Charts, photo: GlobalHue
A Michigan multicultural advertising agency, GlobalHue, invested a substantial budget on a survey last year to find out what America’s cultural and lifestyle profile looks like. As a result agency executives believe there is a blurring of ethnic boundaries in our country. Based on the 2009 survey conducted by an outside company, the agency has concluded bicultural Hispanics are among the most successful and optimistic groups.
The survey of four major population segments was designed to create a comprehensive cultural map of the country to provide marketers updated information. Based on the findings the researchers believe that thanks to bicultural Hispanics’ option to select the elements they prefer from various cultures this group is among the most successful and optimistic groups of those surveyed.
The study indicates the nation is increasing complex and is made up of distinct segments; that the population is splitting into a Bifurcation Chasm of the Engaged/Optimistic and the Disengaged/Pessimistic; that to predict consumer behavior, marketers must understand consumer groups by their current situation and by how they will be prepared to deal with the bifurcation, believed to be growing, in wealth and possibilities.
Specialists identified eight subsegments for each of the four segments surveyed resulting in 32 subsegments the result of the rapidly changing and diversified consumer market. Although they are aware of the cultural differences between people in the four segments, the researchers identified mixed-cluster groups of like-minded Americans in seven macrosegments with common mindsets, beliefs and values that impact consumers’ feelings of optimism and pessimism and influence the degree of engagement in their communities.
For example, the macrosegment they called Haves represents 20 percent of the U.S. population, or 71 million people. It is the most optimistic and engaged group and enjoys the best economic and educational level. This segment, which they consider the most attractive initially for marketers, is also the most balanced across the different groups: Asian, 31percent ; Hispanic, 16.5 percent; African American, 21.5 percent; and non-Hispanic Whites, 16 percent.

Don Coleman, chairman, GlobalHue
“To understand the New America today requires more than a single cultural lens,” said Don Coleman, chairman, GlobalHue. “Instead, it is as meaningful to look for cross-ethnicity similarities as it is to acknowledge cultural differences. With this report, marketers can clearly see a path for connecting with consumer segments from different groups simultaneously through cultural relevance.”
According to the study, the most successful and optimistic Hispanic segments, as self-identified, are bicultural and feel empowered to pick and choose from multiple cultures. At the same time, the most acculturated Hispanic segments are the least successful and most isolated. These are Hispanics who are also the least likely to identify with a community, be bilingual or have strong ties to a country of origin. Many optimistic Hispanics are disengaged, young and like technology.
“The Hispanic segment of the study upends commonly held notions of acculturation,” said Laura Marella, vice chairman, GlobalHue. “The message to marketers is that greater acculturation is, in fact, not a proxy for high-value consumers.”
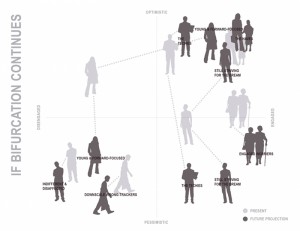
If Bifurcation Continues – click on image to enlarge
To complete the study interviewers contacted 8,309 people online and by phone, in a nationally representative sample, between June 22 and July 15, 2009, broken down by ethnicity as follows: Africanics: 1,777 respondents; Asian: 1,381; Latino: 1,994; non-Hispanic White: 2,748; and other: 409.
A questionnaire with 287 questions covered demographic information, lifestyle habits and attitudes, behaviors regarding media consumption and usage, and technology reliance and usage, as well as shopping, traveling, and entertainment habits. It included Trompenaars Hampten-Turner’s seven cultural dimensions and a modified Myers-Briggs personality profile.
GlobalHue, a marketing communications agency, has 390 employees and offices in Detroit and New York. It has four divisions: GlobalHue Africanic; GlobalHue Latino; GlobalHue Asian; and GlobalHue Next. In 2009, GlobalHue’s capitalized billings were $833.7 million. GlobalHue clients include Verizon, Walmart, Chrysler Group LLC, U.S. Navy, Bermuda Department of Tourism, U.S. Census Bureau, FedEx, MGM Grand Detroit and Merck.


