Posted by Elena del Valle on February 14, 2011

A box of chocolates for Valentine’s Day
Photos: Conrad Miami
Valentine’s Day was declared in A.D. 496 by Pope Gelasius I. Although most of us know little or nothing about the pope the date has become popular as a day to express love and appreciation to those close to us. In the 1840s, a daughter of Massachusetts, is thought to be the first to sell mass-produced valentine cards. The tradition lives on with many people setting aside the day to celebrate love.
Thinking of selling a love related product or service? These figures may interest you. In 2008, 66.9 million opposite-sex couples lived together. In 2009, 2.1 million marriages (about 5,800 a day) took place in the United States; many of them in Nevada. That year 108,150 marriages took place in that arid state, making it the fifth nationally in marriages, even though its total population that year among states was 35th; California ranked first in marriages, according to the National Center for Health Statistics.
In 2010, first marriages took place at a median age of 28.2 and 26.1 years for men and women, respectively. Last year, 54.1 percent of adults responding to a national survey said they were married, according to Families and Living Arrangements: 2010.
At the same time the businesses that offer Valentine’s type products and services employ many people across several business sectors. For example, in 2008, there were 1,317 companies that produced chocolate and cocoa products (in 2009, Americans ate 23.4 pounds of candy per person, according to the Current Industrial Reports, Confectionery: 2009), employing 38,369 people. California led the nation in the number of chocolate and cocoa manufacturing establishments, with 146, followed by Pennsylvania, with 115; there were 422 establishments that manufactured non chocolate sweets products. They employed 16,860 people. California led the nation in this category, with 47 establishments, according to County Business Patterns: 2008.

The Spa at Conrad Miami is offering red rose promotions for Valentine’s Day
Beyond eatables there are many businesses that cater to love birds. Flower, cards and jewelry sellers figure prominently around this sweetheart centered holiday. The combined wholesale value of domestically produced cut flowers in 2009 for all flower-producing operations with $100,000 or more in sales was $359 million (domestic roses accounted for $18 million); again California took the lead, alone accounting for $269 million of the sales (Source: USDA National Agricultural Statistics Service). In 2008, there were 18,509 florists nationwide which employed 89,741 people, according to County Business Patterns.
In 2008, there were 26,683 jewelry stores in the United States. In February 2010, the stores sold $2.4 billion in merchandise, according to County Business Patterns.
Businesses of other types also promote romantic packages or simply Valentine’s Day themed products and services. For example, the Spa at Conrad Miami hotel in Florida is offering red rose promotions between $120 and $200. These include a 60-minute aromatherapy massage and 30-minute organic sweet red rose facial; a 30-minute aromatherapy massage and 60-minute organic sweet red rose facial; and a Champagne mimosa manicure and pedicure and 30-minute organic sweet red rose facial.
Still looking for love? In 2007, there were 393 dating service companies including internet dating services, employing 3,125 people and making $927 million in revenue (source: 2007 Economic Census).
Posted by Elena del Valle on February 9, 2011
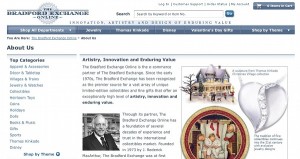
BradfordExchange.com, the most visited jewelry website
Americans hit the web with gusto this past holiday season. December 2010 saw an increase of 80 percent in retails site visits compared to the same time of year in 2009, according to comScore, Inc., a digital metrics company. According to a company spokesperson 85 percent of Americans visited an online retail site this past holiday season. Selling flowers or cards online? You probably did well in December.
The second retail category in online growth was digital seasons greetings with a 32 percent growth and 27.4 million visitors. Buyers of flowers, gifts and greetings were active during the last month of the year; 36.5 million visitors browsed and bought gifts online. Some items required shipping causing a spike in shipping site visits; 33.6 million Americans visited a shipping site in December, up 29 percent from the prior month.
AmericanGreetings Property was the category leader with 10.6 million unique visitors in December (up 28 percent) followed by Gifts.com with 7.7 million visitors, (up 36 percent), Hallmark with 3.8 million (up 10 percent) and 1-800Flowers.com, Inc. with 2.4 million (up 40 percent). ProFlowers.com more than doubled its audience in December, attracting 2.1 million visitors.
MyFunCards.com was the top e-card site with 7.1 million unique visitors (up 77 percent). Next was AG Interactive with 5.9 million visitors, a 47-percent increase. Evite.com came in third with 5.4 million, and 123Greetings.com with 3.3 million visitors (up 35 percent) was next.
Did you dream or splurge? Browse or buy yourself or a loved one jewelry? You were in good company. After watching their pennies during the recession many shoppers bought luxury goods this holiday season, resulting in an all-time high of 26.2 million unique visitors to Jewelry/Luxury Goods/Accessories sites that month.
BradfordExchange.com took the top spot in the category with 2.8 million unique visitors in December (up 15 percent), followed by Zale Corporation with 2.3 million visitors (up 26 percent), Coach.com with 2.1 million (up 14 percent) and Swarovski.com with 2.0 million (up 13 percent), according to comScore.
Posted by Elena del Valle on February 7, 2011
Click to enlarge
Graphic: comScore, Inc.
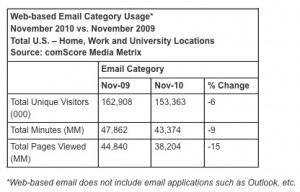
Emails reach more than 70 percent of the U.S online population each month. And, in November 2010, more than 153 million people visited web-based email providers, according to an online data company. Although email remains one of the most popular online activities are people relying less on web based email systems (that excludes applications like Outlook and Thunderbird) and more on mobile email?
A November 2010 comScore study indicates that may be happening. The study found the number of visitors to web based email sites declined 6 percent during that month compared to the previous year. During the same time period, the number of users accessing email via their mobile devices grew 36 percent.
In terms of engagement, the company’s analysts believe overall time spent in the email category declined 9 percent, while total pages viewed dropped 15 percent. Could part of the shift from web based email to mobile email and the level of engagement be the result of higher unemployment nationwide? Is it possible fewer people are accessing emails on the web and surfing online while working because there are fewer people employed?
Although the company’s analysts concluded there was a general change in email related behavior across age groups below 55 they believe young email users between the ages of 12-17 showed the sharpest decline in usage of web based email during the past year. They believe the number of visitors from this age segment declined 24 percent and engagement dropped by half as total minutes fell 48 percent and total pages dropped 53 percent.
There was a greater drop in usage among men; total email minutes for that period dropped 12 percent for men compared to 7 percent for women. On the other hand, use of web based email increase among older adults. Among those 55 to 64 accessing web based email increased 15 percent with similar gains in engagement; users older than 65 experienced gains across all three metrics.
When it came to mobile email in November 2010, 30 percent of all mobile subscribers (70.1 million mobile users, according to their estimates) used a mobile phone to read emails. That was an approximate increase of 36 percent from the previous year, the comScore researchers believe. Adults between 25 and 34 years old were 60 percent more likely to access email than other mobile users; those between the ages of 18-24 were 46 percent more likely to do so than older mobile phone owners. Men were 14 percent more likely to use email on the mobile phones.
ComScore, Inc., a digital measurement company, relied on data from the company’s comScore Media Metrix, which relies on panel-based and website server-based metrics, and MobiLens, a mobile media measurement tool, for the study. The habits of users of mobile devices aged 13 and older were examined in the study.
Posted by Elena del Valle on January 26, 2011
Click to enlarge
Graphic, photo: Organization for Economic Co-operation and Development (OECD)
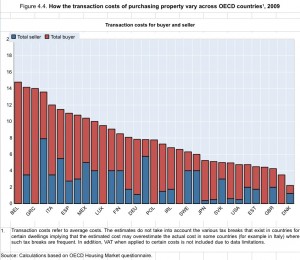
As we look back at the housing market over the past few years and its impact on the economy it is still difficult to understand what exactly went wrong and what it may take to keep it from happening again. Seeing how other developed countries stand on the housing issue may give us some perspective and insights on how to move forward in the future.
According to Housing and the Economy: Policies for Renovation, a recently released chapter from the book Economic Policy Reforms 2011 Going for Growth from the Organization for Economic Co-operation and Development (OECD), which tracks changes in 29 developed countries including the United States, poor housing policies played an important role in triggering the recent economic and financial crisis.
The chapter looks at ways in which housing policies might be designed for better results. The Organization’s analysts believe “effectively supervised financial and mortgage market development combined with policies that enhance housing supply flexibility are key for macroeconomic stability.”
Here are some of the analysts conclusions and recommendations from the chapter: Appropriate housing policies, designed for efficiency and equitability, can help residential mobility, match workers with jobs and assist the job market recovery. Any changes in the mortgage markets should be accompanied by regulatory oversight and careful banking regulations; and housing supply responsiveness to demand has the potential for improvement in many of the markets examined as long as investment in residential real estate is dealt with to avoid volatility.
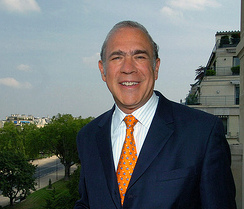
Angel Gurria, secretary-general, OECD
“OECD countries have seen the damage caused by badly designed policies through their effects on housing markets,” said Angel Gurria, secretary-general, OECD in a press release. “As we search for new sources of growth, as we seek to restore trust in our financial sectors, as we try to green our economies, policies related to housing can have a huge impact on our future”.
The United States is in good company when in comes to housing and economic problems. The OECD says that easy credit over the past two decades increased the volatility of prices resulting in housing price jumps of 90 percent or higher in Australia, Belgium, Finland, Ireland, Netherlands, New Zealand, Norway, Spain and the United Kingdom over the study period. Poor supervisory systems alongside deregulation and innovation in mortgage markets led in part to a “significant relaxation in lending standards, an increase in non-performing loans and the sub-prime crisis.”
The Organization recommends an increase in responsiveness of new housing supply to market demand, specifically the revisiting of licensing procedures that limit new housing projects and reconsidering land-use regulations that unduly prevent development. Its analysts believe a better supply may lead to less price volatility, fewer excessive price increases and encourage labor mobility.
It also supports the elimination of tax policies that favor housing over other types of investments. Such favoritism can lead to cheap lending fees which can lead to excessive investment, speculation and price volatility while at the same time limiting mobility. It encourages a system in which property taxes more accurately reflect the true market value of property.
Posted by Elena del Valle on January 24, 2011

Click to enlarge
Photos: Organization for Economic Co-operation and Development, Peter Sommer, Ph.D.
How fragile are our cyber systems? How much effort and sophisticated technology would it take to bring a company or a government office down with a cyber attack? What about a global disruption? Although the technology is constantly changing and no one seems to know the answers for sure there is concern and much speculation on the topic.
A reassuring report released last week indicates it would be difficult to cause serious problems on a world wide scale although it cautions that “Governments nevertheless need to make detailed preparations to withstand and recover from a wide range of unwanted cyber events, both accidental and deliberate. There are significant and growing risks of localised misery and loss as a result of compromise of computer and telecommunications services.”
Examples of single cyber-related events with vast capacity for damage could include an attack on one of the technical protocols the Internet depends on like the Border Gateway Protocol which determines routing between Internet Service Providers; and a very large-scale solar flare if it physically destroys key communications components like satellites, cellular base stations and switches.
What about malicious attacks designed for espionage, to affect distributed denial of service, and the acts of criminals, recreational hackers and hacktivists? According to the two researchers who authored the report such attacks would have a local impact and a brief duration.
They believe cyber warfare is the source of myths mostly. The reason they believe such a situation would be unlikely is because essential computer systems are designed to resist such attacks and malware. Because identifying the actual attackers in cyber attacks is very difficult they suggest defense against cyberweapons should focus on resilience, a combination of preventative measures and alternative plans to allow rapid recovery in case of a successful attack.
They also point out that a significant portion of the infrastructure is most of the countries they studied (OECD countries) are privately owned and not government controlled.

Peter Sommer, Ph.D., coauthor, Reducing Systemic Cybersecurity Risk
“The specific challenges faced by the US, apart from the range of entities that regard it as a target, are the number of powerful Departments (and their supporters in the Senate, the Congress and the arms industry lobbyists) all claiming that they should lead,” said Peter Sommer, Ph.D., coauthor of the report, by email in response to a question about the cyber risk issues as they relate to the United States. “The main players are: the Pentagon (and indeed individual armed services), Department of Homeland Security, Department of Commerce, NSA and FBI. So far President Obama and his cybersecurity advisor Howard Schmidt do not appear to have been able to knock heads together.”
Sommer, visiting professor in the Information Systems and Innovation Group in the Department of Management at the London School of Economics, and Ian Brown, Ph.D., research fellow, Oxford Internet Institute, Oxford University are the coauthors of Reducing Systemic Cybersecurity Risk, a 121-page report published by the Organization for Economic Co-operation and Development (OECD), part of the OECD/International Futures Programme Project on Future Global Shocks.
Brown’s research is focused on public policy issues around information and the Internet, particularly privacy and copyright. He also works in the more technical fields of communications security and healthcare informatics. The Organization for Economic Co-operation and Development provides a forum for member governments to compare policy experiences, “seek answers to common problems, identify good practice and coordinate domestic and international policies.”
Posted by Elena del Valle on January 19, 2011

Photos: Tiffany and Company, Nordstrom
Judging by the end of year sales and revenue reports, it looks like a lot of wealthy shoppers indulged this holiday season. Tiffany & Co. must have a reduction in stock of its famous gift box. While shopping in general during this holiday season rose only 18 percent, purchases by well to do shoppers increased 45 percent, according to a Gallup poll. High-end stores like Neiman Marcus and Tiffany & Co. had strong sales, significantly higher than a year ago.
Neiman Marcus Inc. had a 4.9 percent increase in revenue compared to the same time last year, $583 million compared to $556 million. Revenue for the well known jewelry company increased 7 percent in the United States (in Asia sales were up 15 percent).
Although the holiday season sales in 2009 and 2010 were lower than during pre economic downturn years, luxury spending between November 28, 2010 and January 1, 2011 increased 8.5 percent while the previous year it only increased 5.5 percent; jewelry sales for the same period increased 10.4 percent. Luxury sales are 6.9 percent lower and jewelry sales are 8.9 lower than before the recession, according to a recent The Associated Press article (Holidays were extra bright for high-status stores).
Luxury spending, especially on automobiles, services, travel and children’s clothing, may rebound for the first time in three years, according to the Survey of Affluence and Wealth in America.

The online poll of 1,900 households with an average annual income in excess of $235,000 by American Express Publishing and Harrison Group indicated that 94 percent of respondents still believed when they answered the questions that the United States is in a recession. The households surveyed between January 2010 and April 2010 represent 10 percent of Americans and 50 percent of all retail sales.
These numbers confirm the similar conclusions based on other indicators that high net worth individuals are recovering confidence and upping their spending (see Income growth slowing, economic divide widening). If luxury spending is increasing at a higher rate than general spending perhaps that is where new products and services will be developed and promoted by forward thinking businesses at least until the rest of the market catches up.
Posted by Elena del Valle on January 13, 2011
Blogged.com, a Southern California site striving to promote social discussions about news from various media sources, rated HispanicMPR.com Excellent with a score of 9.2 out of 10. According to Blogged, Editor Reviews, that site’s unbiased critique by editors of English language sites, are based on frequency of updates, relevance of content, site design, and writing style and compared to other blogs within the same category.

Cambridge, Massachusetts based WebsiteGrader.com, owned by HubSpot, rated HispanicMPR.com 99 of 100. According to the WebsiteGrader website, “A website grade of 99/100 for hispanicmpr.com means that of the millions of websites that have previously been evaluated, our algorithm has calculated that this site scores higher than 99% of them in terms of its marketing effectiveness.” The site accomplishes the grading with its own blend of 50 variables, including search engine data, website structure, traffic, and site performance.
Posted by Elena del Valle on January 12, 2011

Click to enlarge
While many consider 2010 an improvement over 2009 and some are optimistic about 2011 few can dispute the lingering effects of the recession on Americans. Although there are signs the economy is improving the number of unemployed nationally is alarming. And we are not alone. Beyond the United States the economic downturn has affected many countries which also exhibit sluggish growth and disappointing employment numbers, in many cases with far higher percentages than those in the United States.
According to a United Nations report (see Further sharp increases in global food prices ‘likely’, UN.org) the price of food is increasing around the globe. Recently an industry expert predicted that due to increasing demand and limited supply the price of gasoline may reach $5 per gallon as soon as 2012. Some point out that these are the normal ways in which artificially inflated economies right themselves, part of a normal cycle with highs and lows. In short, nothing to worry about in the long term.
Yet other data such as the increasingly alarming debt ratios of developed countries including the United States and many Western European countries (see Debt to growth ratios and their impact on business), and an abundance of developed countries with aging population demographics could signal that there is more to the situation that a cursory look might reveal.
If we step back and look at the changes over decades (see Income Inequality: Too Big to Ignore, The New York Times October 16, 2010) the picture that emerges is interesting. During the thirty years that followed World War II, the income of Americans grew 3 percent a year across income levels, fomenting a healthy middle class, well developed infrastructure and growing optimism.
In light of the recent economic downturn fewer voters are willing to support basic updates to infrastructure and public services leaving the country with troubled roads and bridges, a weak rail system, and poor safety standards such as cargo containers that enter our ports without scrutiny and dams in danger of collapsing.
During the past three decades economic growth has slowed, our infrastructure has fallen into disrepair and income growth is evident mostly among the highest percent of earners. For example, in 1976, the share of total income for the top 1 percent of earners was 8.9 percent; by 2007 it had reached 23.5 percent. During that same period the rest of the population’s average hourly wages, once adjusted for inflation, decreased by more than 7 percent. In summary, according to those statistics the ultra wealthy are becoming wealthier and everyone else is becoming less affluent.
Between 1983 and 2007 the most notable gains in wealth and income were among the most affluent 20 percent of the population, especially the top 1 percent, which received 35 percent of the total growth in net worth, 43 percent of the total growth in non home wealth and 44 percent of the total increase in income, according to Recent Trends in Household Wealth in the United States: Rising Debt and the Middle Class Squeeze – an Update to 2007 by Edward N. Wolff published by the Levy Institute of Bard College March 2010. According to the 58-page paper, in 2007, the top 1 percent of the population (those with net worth of $8.2 million or higher) in the country owned 49.3 percent of stocks and mutual funds, 60 percent of financial securities, and 62 percent of business equity. In contrast, the bottom 90 percent of the population owned 10.6 percent of the stocks and mutual funds, 1.5 percent of the financial securities, and 6.7 percent of the business equity.
An example of that are billionaires Warren Buffet and Bill Gates who have decided they are so exceedingly wealthy that they want to share their fortunes with humanity, making a commitment to distribute part of their wealth while they are alive. Recently they recruited other individuals to participate in the project, including Mark Zuckerberg the much talked founder of Facebook who although he is only 26 is wealthy enough to make the cut.
So what do these changes mean for businesses and business people? While only time will tell for sure in the short term it would appear that it is a good time to begin or continue marketing to the very wealthy; emphasizing products that represent good value for money to middle class and wealthy consumers and budget products to just about everyone except those at the very top of the income earners and asset holders.
Posted by Elena del Valle on January 5, 2011
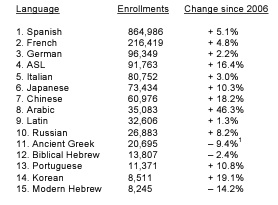
U.S. student enrollment by language 2006-2009 per MLA report
Graphic: Modern Language Association of America
Interest in foreign languages in colleges in the United States increased 6.6 percent between 2006 and 2009. Foreign language enrollment has also been increasingly diverse including a broad range of language studies, according to a new report, Enrollments in Languages Other Than English in United States Institutions of Higher Education, Fall 2009, released December 2010 by the Modern Language Association of America (MLA).
Arabic popularity rose as did Korean and Chinese. Although French, German and Italian were popular Spanish was the most popular foreign language by a wide margin with 864,986 students enrolling in classes during the time period of the report.
“It’s gratifying to see that so many US students recognize the importance of language study for our future,” said Rosemary G. Feal, executive director, Modern Language Association of America in a press release. “The demand for an ever-greater range of languages demonstrates the vitality of the field. Despite troubling cutbacks in language offerings at some institutions, this report shows that overall language remains strong at US colleges and universities.”
The MLA report, produced since 1958, is described as the longest-running and most comprehensive analysis of the study of languages other than English at United States colleges and universities. The report includes undergraduate and graduate course enrollments in languages other than English in fall 2009 for 2,514 AA-, BA-, MA-, and PhD-granting colleges and universities in the United States. The researchers believe these 2,514 institutions represent 99 percent of all higher education institutions offering language courses in the country.
The Modern Language Association of America, dedicated to strengthening the study and teaching of languages and literature, has 30,000 members in 100 countries. Founded in 1883, the MLA strives to provide opportunities for its members to share their scholarly findings and teaching experiences with colleagues and to discuss trends in the academy. According to the MLA website the organization produces twelve new books a year and a variety of publications for language and literature professionals and for the public.
Posted by Elena del Valle on January 3, 2011

We wish you and yours a wonderful, healthy and prosperous 2011!


