Posted by Elena del Valle on May 23, 2011

Eduardo Gamarra, Ph.D., managing partner, Newlink Research
Photo: Newlink Research
According to the results of Latinos’ Emotional Connection with Companies and Brands, a 2011 survey conducted by Newlink Research and released recently, the majority of adult Hispanics polled favored companies with Latino community involvement. The study, commissioned by Garcia Trujillo Holdings, LLC, was designed to explore whether perceptions about the way in which domestic large companies and brands treat Hispanics affect the ability of those companies to attract United States Latinos as consumers.
More than 66 percent of survey respondents said they would be more inclined to buy products and services from, and 64.7 percent said they would be even be more loyal to, companies that demonstrate a strong and visible commitment to the Hispanic community.
“Considering that Hispanics make up about 16 percent of the population of the United States and that over the next four decades they will represent the largest growing market segment, U.S. companies should begin to take into account this enormous gap and begin to structure responses that prepare them for the future,” said Eduardo Gamarra, Ph.D., managing partner, Newlink Research and professor at Florida International University. “Hispanic human capital already represents an enormous underutilized resource.”
Researchers concluded that although 59.3 percent of the consumers surveyed said they believe the Hispanic market is important to companies and brands in the United States almost 42 percent of respondents also believe those companies have little respect for them as consumers. Most (94 percent) of the respondents to the survey said they would like companies to have Spanish speaking spokespeople in their advertising and information campaigns and 15.5 percent would welcome products and services designed for Latinos.
At the same time, many respondents, more than 60 percent, said they believe Hispanic workers face serious obstacles to advancement; and 42 percent thought companies provide poor growth opportunities for Hispanics. Nearly 60 percent indicated they believe language and a college degree (21.7 percent) are the main obstacles. Many of the survey takers, 60 percent, said they believe companies are committed to their Latino employees but that few (less than 10 percent) of those employees are likely in management or leadership roles in companies in the United States.
The survey was conducted among 1,100 adult Hispanic consumers residents of the four districts with the greatest concentration of Hispanics in the United States (Southeast, Northeast, Southwest and West) between January 24 and 29, 2011. Bilingual operators conducted 15-minute interviews in English or Spanish according to the preference expressed by individual respondents. The sample took into account standard age, gender, and national origin parameters.
Garcia Trujillo Holdings, LLC offers strategy, execution, organization, and mergers and acquisitions consulting services. Newlink Research is part of Newlink Group, a family of communications and business services firm focused on the United States Hispanic market and Latin America. Newlink America is the U.S. Hispanic division founded and run by Jorge Ortega and Eduardo del Rivero.
Posted by Elena del Valle on May 18, 2011
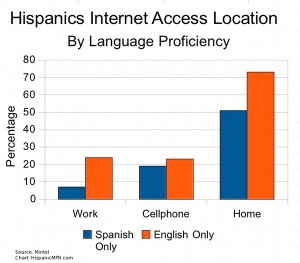
Hispanic Internet Use Location by Language – click to enlarge
A large majority of Hispanics with an income of $50,000 and higher is likely to use the internet while only 59 percent of Hispanics earning $25,000 and under is likely to do so, according to the recently released results of a Mintel survey.
In the same report Mintel indicated that members of blue collar Hispanic households that responded to the survey exhibited minimal internet usage. Many of the individuals in these households worked in positions that did not require use of a computer or access to the internet.
Acculturated Hispanics who live in a household where at least some English is spoken are more likely to surf the web than their less or least acculturated Spanish dominant counterparts, according to the Mintel findings. Most (95 percent) of adults in English only households use the internet compared to only just over half of adults in Spanish only homes.
The researchers believe these Spanish dominant and low income Latino market segments are rife with marketing opportunities for internet use and promotion. Mintel, an international research company, surveyed 531 nationally representative U.S. Hispanic respondents aged 18 and older in October 2010 used to prepare the report, Hispanics Online.
Posted by Elena del Valle on May 9, 2011

Debra L. Ness, president, National Partnership for Women and Families
Photos: National Partnership for Women and Families, American Association of University Women
On average, full-time working women in the United States are paid $10,622 less than their male counterparts, according to recent research conducted by the National Partnership for Women and Families, in conjunction with the American Association of University Women (AAUW), in all 50 states and the District of Columbia.
In California, for example, where 1,593,474 households are headed by women, there is a wage gap of $8,370 between full-time working men and women. In New York, 1,050,106 households are headed by women and there is a wage gap of $8,590; in Florida 897,308 households are headed by women and the wage gap is $7,013 between full-time working men and women.
The researchers in this case estimate that were the gap to close it would have a dramatic impact on the lives of many families. They point out that in Alaska, but for the gap women could buy 1.7 years’ worth of food; working women in Connecticut could afford 15 more months of rent; their counterparts in Michigan could make 10 more months of mortgage and utility payments; and working California women could buy 2,100 more gallons of gas.
“This new data illustrate the very real harm unequal wages are doing to America’s working families,” said Debra L. Ness, president, National Partnership for Women and Families. “It is long past time to close the gender-based wage gap. With women playing an increasingly important role as family breadwinners, there is no time to waste.”
Although women head nearly 14.5 million households nationwide and the majority of working mothers in the United States are the source of at least a quarter of their families’ earnings, women working full-time are only paid an average of 77 cents for every dollar paid to full-time working men, according to the Partnership. Since the 1963 Equal Pay Act passed the wage gap has narrowed half a cent per year, the research points out; and if it continues the same way, the working women of tomorrow will earn the same as the men by 2058.

Linda Hallman, executive director, American Association of University Women
“This research proves that the gender pay gap is not simply a numbers issue or a women’s issue,” said Linda Hallman, executive director, the American Association of University Women. “It’s a bread and butter issue. It’s an everyday issue for people who are trying to support their families and provide for their futures. No more lip service, it’s time to act.”
It is harder still for African-American and Latino women. Nationally, in 2009, African-American women working full-time, year-round were paid only 61 cents for every dollar paid to men and Latinas only 52 cents, for every dollar paid to white, non-Hispanic men.
Established in 1971, the National Partnership for Women and Families is dedicated to creating “a society that is free, fair and just. Where nobody has to experience discrimination, all workplaces are family-friendly, and no family is without quality, affordable health care and real economic security.” The mission of the American Association of University Women, a nationwide network of more than 100,000 members and donors, is to advance “equity for women and girls through advocacy, education, philanthropy, and research.”
Posted by Elena del Valle on April 25, 2011

Photo: Brookings Institution
Although little information seems available about the attitudes and opinions of the up and coming generations, D.C.’s New Guard: What Does the Next Generation of American Leaders Think?, a 22-page report on the findings of a recent survey among youth with an interest in political careers, indicates this subgroup of the Millennial Generation, a large demographic group by all accounts, has its own characteristics and opinions as might be expected.
In terms of their political affiliations, 38.2 percent self identified as Democrats, 28.8 percent as Independents, and 26.4 percent as Republican. The profile is, according to the survey authors, different than the trends in the prior Generation X who grew up in the Reagan-era and exhibited more conservative attitudes than the Millennials. What the authors found most interesting was the large segment of youth leaders who remained unaffiliated with a political party even though many expressed views that might be associated with the Democratic point of view.
Want to target this group of leaders who may include future mayors, governors, and representatives through a news medium? Don’t try the evening news or late night comedy shows. While their responses to the survey indicate their source of news is traditional new organizations the evening news and late night comedy shows ranked low among them as a source of news. Thirty percent of Republican respondents preferred cable news to stay informed while Democrats and Independents consumed news from online news websites.
Who do they look up to when forming political opinions? Many of the respondents, 61 percent, said their parents were major influences. Political leaders accounted for 19 percent and media 12 percent. The survey authors concluded this aspect of the Millennials was quite different from the Baby Boomer Generation. When the Baby Boomers were young they tended to select a political view that was the opposite of that of their parents’. Celebrities and faith leaders had a relatively low political influence level among young Millennial leaders.
Assuming that the models young people admire today may influence their attitudes tomorrow, the survey authors asked what leaders from history they admired. More than one third (under 36 percent) chose a military leader or civilian leader closely associated with wartime like Franklin Delano Roosevelt, Abraham Lincoln, Dwight Eisenhower and Woodrow Wilson. The survey authors believe that is not surprising given that the United States the respondents have known to date has been at war for a majority of their lives. Fourteen percent admired a founding father such as Thomas Jefferson, James Monroe and Alexander Hamilton while 10 percent chose leaders of social change such as Martin Luther King, Jr. and Nelson Mandela. About one percent chose a religious figure such as Mother Theresa or the Prophet Mohammed as a leadership model for the 21st century.
When asked about a leader today that they admired more than 49 percent said Barack Obama, well past any other leader named. The political affiliations of those who preferred Obama as their “ideal leadership model,” were 62.8 percent Democrats, 28.5 percent Independents and 8.7 percent Republicans. Other listed as models who received between one and five percent included John McCain (with 5.5 percent favoring him as their model leader), Al Gore, Bill Clinton, Colin Powell, Condoleezza Rice, Nelson Mandela and Hillary Clinton.
Although the survey authors did not ask about the ethnicity or cultural background of respondents (or did not share the information in the report), it is safe, based on the degree of diversity among American youth revealed by 2010 Census, to assume some degree of diversity among the respondents. It is unclear from their findings exactly what affiliations and opinions Hispanics, African Americans, Asians and others in this group of leaders may have. Now that this youth demographic group has been identified as worth watching maybe future surveys and research will reveal more about the leadership attitudes of the Millennial Generation and its diverse market segments.
The survey, published on the Brookings Institution website in February 2011, was conducted among 1,057 young American leaders who were attendees at the National Student Leadership Conference, as well as the Americans for Informed Democracy young leaders’ courses, and DC internship programs by P.W. Singer, Heather Messera, and Brendan Orino. The respondents were 16 plus years old on average, 45 percent women and 55 percent men. The largest geographic representation was 34.6 percent from the Mid-Atlantic region followed by 15 percent from the South, 14 percent from the Pacific, 13 percent from the Midwest, 12.1 percent from New England, 8.7 percent from the Southwest, and 2.6 percent from the West. The northeast was overrepresented while the rest of the country was underrepresented according to the survey authors.
Posted by Elena del Valle on April 11, 2011
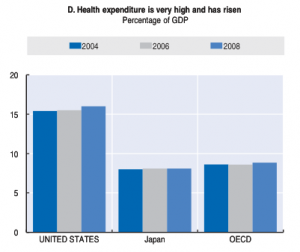
Health care expenditure comparisons – click to enlarge
Graphs: Organization for Economic Co-operation and Development (OECD)
A new Organization for Economic Co-operation and Development (OECD) 227-page report, Economic Policy Reforms Going for Growth, highlights issues relating to growth among member, and some non member countries. The report outlines salient issues and suggested recommendations for individual countries including the United States. While the organization’s researchers concluded our GDP (gross domestic product) is one of the highest among OECD members thanks to high labor productivity they found relative labor utilization had dropped. They noted the benefits of recent health care and financial sector changes while calling for additional changes they believe to be necessary especially in education, health care and tax reform.
The first priority the analysts drew attention to was education, explaining that in spite of high per pupil spending United States student scores were below the OECD average in the international student test (PISA). The report calls for an improvement in teacher education and development in order to increase student achievement; and suggests the United States make schools accountable for student progress. In light of the 2010 Census numbers that point to minority markets as the main source of demographic growth in the country the importance of education among minority students is likely waxing.

Secondary education performance comparison – click to enlarge
Health care expenses are already high and continue rising at a steady pace, according to the report released last week. The researchers concluded that while last year’s health care reform law reduced long term expenditures it is unclear how it will affect health care. They recommend the adoption of Medicare provider reforms after pilot testing; and that the health tax exclusion (i.e. the exclusion from taxable income and payroll tax of compensation in the form of health insurance cover) be limited beyond what was planned to reduce incentives for people to buy health plans with little cost sharing.
The report recommends the United States broaden the tax base by “reducing the value of the mortgage-interest deduction on owner-occupied housing and limiting the health tax exclusion.” The analysts also think a move away from personal income towards consumption-based taxes such as a VAT is worth pursuing. Other recommendations included the reduction of agricultural subsidies and the adoption of policies that promote social mobility.
The OECD, about to turn 50, provides a forum for member governments to compare policy experiences, “seek answers to common problems, identify good practice and coordinate domestic and international policies.”
Posted by Elena del Valle on March 7, 2011

Twenty-two percent of survey respondents picked Head and Shoulders Shampoo as their favorite
Photo: Procter and Gamble
A 2010 Mintel survey of Hispanic personal care product attitudes and shopping habits indicates Latinos are brand loyal to their shampoo and conditioner across household income levels. In spite of the economic slow down, 60 percent of respondents to the survey said they buy the same brand of shampoo and conditioner. This was especially true for Spanish dominant shoppers.
Hispanics also favored styling products. Forty-six percent of survey participants said they buy styling gels and lotions, a greater percentage than Asians, Blacks and Whites.
More Hispanics, 57 percent, said they rely on conditioners to soften and detangle their hair than Whites, 49 percent. Many respondents in the Latino and Asian market segments, 24 percent, like to color their hair compared to only 18 percent of Whites and 20 percent of Blacks.
The top three shampoo brands among Latinos who participated in the survey were Head and Shoulders (preferred by almost one quarter of these survey takers) followed by Pantene and Suave.
English dominant Latino respondents didn’t respond well when it came to hairspray: 46 percent of English-dominant Hispanics said that they do not buy hairspray in comparison with 24 percent of Spanish dominant respondents.
Mintel is an international research company. This Mintel survey was conducted online in August 2010 among 534 U.S. Hispanic respondents aged 18 and older.
Posted by Elena del Valle on February 28, 2011

Spanish dominant Latinos continue to buy name brand personal care products, according to a 2010 survey
Photos: Procter and Gamble
Looking for a brand loyal market segment? While many consumers are cutting back on costs and choosing less expensive products during the recession lower income Spanish dominant Latinos continue to buy name brand personal care products; more than English dominant Latinos, according to a recent Mintel survey conducted online in August 2010 among 534 U.S. Hispanic respondents aged 18 and older.
Although many of the survey respondents had a lower-than-average household income level, they indexed higher than non-Hispanics in the consumption of personal care products in 2009. According to Mintel, over the last six years, Hispanics have consistently spent more on personal care products; although the researchers expect to find a less than 1 percent drop for 2010. Hispanics who responded to the survey index higher than non-Hispanics in the purchase of haircare products and bath products.
“Spanish-dominant Hispanics are most likely to stick to their favorite brand of hand soap, body soap and shower gel, signifying that less acculturated Hispanics remain loyal to the same brand despite the economy,” said Leylha Ahuile, senior multicultural analyst at Mintel, a research company. “English-dominant Hispanics tend to have higher household incomes and apparently are less concerned with brand name soaps and more focused on saving money.

Many of the Latino survey respondents said they favor multifunctional products
In spite of Hispanics’ lower-than-average household income level, they indexed higher than non-Hispanics in the consumption of personal care products in 2009. Over the last six years, Hispanics have consistently increased their spending on personal care products. And within personal care, Hispanics index higher than non-Hispanics in the subcategories of haircare products and bath products.”
Among the those surveyed by Mintel 64 percent of Hispanics who said they have an income between $25,000 and $49,999 said they still buy name brand body soaps or shower gels compared to 58 percent of English-dominant Hispanics who said they continue to buy name brand body soaps or shower gels even during the economic downturn.
Although they could switch to more affordable products Spanish-dominant consumers who responded to the survey said they are also more likely to stick to their favorite name brand lotions (51 percent versus 35 percent of English-dominant consumers), facial cleansers (27 percent versus 20 percent of English-dominant consumers) and toothpaste or mouthwash (69 percent versus 65% percent of English-dominant consumers).
Many of the lower-income Hispanics who participated in the survey indicated they are interested in saving money with multifunctional products. For example, 65 percent of those who earn between $25,000 and $49,999 said they are interested in two-in-one shampoo/conditioner, and 83 percent said they would be more inclined to purchase toothpaste that can also serve as a mouthwash and whitener.
Posted by Elena del Valle on February 21, 2011

Where did people in the United States go online the final month last year? Most of the names are familiar. Yahoo!, Google, Microsoft, Facebook, AOL, Ask Network, Amazon, Glam Media, Turner Digital and CBS Interactive were the top 10 websites visited by Americans December 2010, according to comScore, an online media measurement company.

Viacom Digital, Wikimedia Foundation Sites, Apple Inc., eBay, New York Times Digital, Demand Media, Fox Interactive Media, VEVO, Comcast Corporation, and Answers.com Sites make up the following 20 sites on the list.
Yahoo! Sites had 181.2 million visitors, followed by Google Sites with 179.3 million and Microsoft Sites with 177.0 million. Amazon Sites, with more than 91 million visitors, had its highest month of traffic on record from the holiday shopping surge, ranking number seven overall. It wasn’t all shopping online that month.

The Weather Channel and WeatherBug property both moved up the rankings in December, climbing six places and eight places, respectively. Winter blizzards and holiday travel likely prompted travelers and shoppers alike to check on the latest weather news.

Click to enlarge
According to comScore, although there is no mention of speakers of foreign languages in the United States, Google ads reached an estimated 93.3 percent of Americans online. Others with high reach on the list were Yahoo! Network Plus with an 86.6-percent reach, Yahoo! Sites with 85.5 percent and AOL Advertising with 85.0 percent. Amazon.com had a 36.0-percent reach.
Although the comScore data did not include information for demographic groups, a Pew Hispanic Center survey released earlier this month indicates Latinos may be less likely than whites to access the internet, have a home broadband connection or own a cell phone. The Pew researchers concluded that in 2010, 65 percent of Hispanic and 66 percent of black adults went online while 77 percent of white adults did so. Among those surveyed by Pew regarding broadband use at home, 45 of Latinos respondents said they have it, 65 percent of whites and 52 percent of blacks who answered the questions said they have broadband access at home.
Posted by Elena del Valle on February 14, 2011

A box of chocolates for Valentine’s Day
Photos: Conrad Miami
Valentine’s Day was declared in A.D. 496 by Pope Gelasius I. Although most of us know little or nothing about the pope the date has become popular as a day to express love and appreciation to those close to us. In the 1840s, a daughter of Massachusetts, is thought to be the first to sell mass-produced valentine cards. The tradition lives on with many people setting aside the day to celebrate love.
Thinking of selling a love related product or service? These figures may interest you. In 2008, 66.9 million opposite-sex couples lived together. In 2009, 2.1 million marriages (about 5,800 a day) took place in the United States; many of them in Nevada. That year 108,150 marriages took place in that arid state, making it the fifth nationally in marriages, even though its total population that year among states was 35th; California ranked first in marriages, according to the National Center for Health Statistics.
In 2010, first marriages took place at a median age of 28.2 and 26.1 years for men and women, respectively. Last year, 54.1 percent of adults responding to a national survey said they were married, according to Families and Living Arrangements: 2010.
At the same time the businesses that offer Valentine’s type products and services employ many people across several business sectors. For example, in 2008, there were 1,317 companies that produced chocolate and cocoa products (in 2009, Americans ate 23.4 pounds of candy per person, according to the Current Industrial Reports, Confectionery: 2009), employing 38,369 people. California led the nation in the number of chocolate and cocoa manufacturing establishments, with 146, followed by Pennsylvania, with 115; there were 422 establishments that manufactured non chocolate sweets products. They employed 16,860 people. California led the nation in this category, with 47 establishments, according to County Business Patterns: 2008.

The Spa at Conrad Miami is offering red rose promotions for Valentine’s Day
Beyond eatables there are many businesses that cater to love birds. Flower, cards and jewelry sellers figure prominently around this sweetheart centered holiday. The combined wholesale value of domestically produced cut flowers in 2009 for all flower-producing operations with $100,000 or more in sales was $359 million (domestic roses accounted for $18 million); again California took the lead, alone accounting for $269 million of the sales (Source: USDA National Agricultural Statistics Service). In 2008, there were 18,509 florists nationwide which employed 89,741 people, according to County Business Patterns.
In 2008, there were 26,683 jewelry stores in the United States. In February 2010, the stores sold $2.4 billion in merchandise, according to County Business Patterns.
Businesses of other types also promote romantic packages or simply Valentine’s Day themed products and services. For example, the Spa at Conrad Miami hotel in Florida is offering red rose promotions between $120 and $200. These include a 60-minute aromatherapy massage and 30-minute organic sweet red rose facial; a 30-minute aromatherapy massage and 60-minute organic sweet red rose facial; and a Champagne mimosa manicure and pedicure and 30-minute organic sweet red rose facial.
Still looking for love? In 2007, there were 393 dating service companies including internet dating services, employing 3,125 people and making $927 million in revenue (source: 2007 Economic Census).
Posted by Elena del Valle on February 9, 2011
BradfordExchange.com, the most visited jewelry website
Americans hit the web with gusto this past holiday season. December 2010 saw an increase of 80 percent in retails site visits compared to the same time of year in 2009, according to comScore, Inc., a digital metrics company. According to a company spokesperson 85 percent of Americans visited an online retail site this past holiday season. Selling flowers or cards online? You probably did well in December.
The second retail category in online growth was digital seasons greetings with a 32 percent growth and 27.4 million visitors. Buyers of flowers, gifts and greetings were active during the last month of the year; 36.5 million visitors browsed and bought gifts online. Some items required shipping causing a spike in shipping site visits; 33.6 million Americans visited a shipping site in December, up 29 percent from the prior month.
AmericanGreetings Property was the category leader with 10.6 million unique visitors in December (up 28 percent) followed by Gifts.com with 7.7 million visitors, (up 36 percent), Hallmark with 3.8 million (up 10 percent) and 1-800Flowers.com, Inc. with 2.4 million (up 40 percent). ProFlowers.com more than doubled its audience in December, attracting 2.1 million visitors.
MyFunCards.com was the top e-card site with 7.1 million unique visitors (up 77 percent). Next was AG Interactive with 5.9 million visitors, a 47-percent increase. Evite.com came in third with 5.4 million, and 123Greetings.com with 3.3 million visitors (up 35 percent) was next.
Did you dream or splurge? Browse or buy yourself or a loved one jewelry? You were in good company. After watching their pennies during the recession many shoppers bought luxury goods this holiday season, resulting in an all-time high of 26.2 million unique visitors to Jewelry/Luxury Goods/Accessories sites that month.
BradfordExchange.com took the top spot in the category with 2.8 million unique visitors in December (up 15 percent), followed by Zale Corporation with 2.3 million visitors (up 26 percent), Coach.com with 2.1 million (up 14 percent) and Swarovski.com with 2.0 million (up 13 percent), according to comScore.


