Latest American Community Survey points to few changes in income, poverty increase in 17 states
Posted by Elena del Valle on September 24, 2012

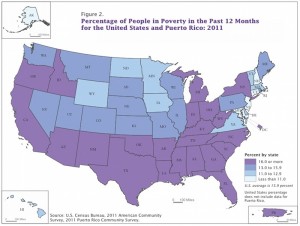
U.S. Poverty by State 2011 – click to enlarge
Graphic: U.S. Census Bureau American Community Survey 2011
Median household income remained mostly unchanged between 2010 and 2011 in 32 states and the District of Columbia, according to the U.S. Census report Household Income for States: 2010 and 2011. Last year, median household income ranged from $36,919 in Mississippi to $70,004 in Maryland.
The median household income nationally was $50,502. It was lower than the national median in 27 states and higher in 19 states and the District of Columbia. North Dakota, Wisconsin, Nebraska and Pennsylvania median household incomes did not have a statistically significant difference from the U.S. as a whole.
Poverty numbers, unlike median household income numbers, increased in 17 states for the same time period according to the report Poverty: 2010 and 2011, which compares poverty rates in 2010 and 2011 for the nation, states and large metropolitan areas. At the state level, New Hampshire (8.8 percent) had the lowest poverty rate, and Mississippi (22.6 percent) had one of the highest poverty rates. The map above illustrates how most of the bottom half of the country, marked in purple, has a high percent of poverty.
In metro areas with populations of 500,000 or more, poverty rates ranged from a low of 8.3 percent in the Washington metro area, to 37.7 percent in McAllen-Edinburg-Mission, Texas. For 10 states, this was the third consecutive annual increase in the number and percentage of people in poverty.
In five states, the number of people in poverty increased but the poverty rates did not go up. Between the 2010 and 2011 American Community Survey, the percentage and number of people in poverty in Vermont declined.


